
INTRODUCTION
The resource gap for family planning (FP) in Bangladesh is crucial for tackling the low prevalence of modern contraceptive use, which generates a high unmet need and high discontinuation rate of FP methods. The poor couples have lower rates of contraceptive use and higher unmet need for contraceptives than their counterparts.1,2 However, higher unmet need for the poor than the rich results from high disparities in access to FP services.3 Evidence shows that limited access and the high cost of contraceptives are critical barriers in low- and middle-income countries.4 Therefore, it is imperative to have the financial capacity of the couples to afford the method of their choice to control fertility effectively. This means there should be a guarantee of not putting pressure on family resources to access FP methods.5 Therefore, to reduce the total fertility rate (TFR), family planning services must be accessible without financial hardship.2 Evidence shows that limited access to FP services, especially modern methods in low- and middle-income countries, is essential for high TFR.6,7 Increasing use of modern contraceptive methods has led to commendable success in declining TFR in Bangladesh.8 There is much scope for further declining TFR through reducing unmet need and discontinuation rate. Note that there is still an unmet need for modern methods among 12% of married couples.9 There is also a growing trend of discontinuation of modern methods.9
This situation calls for tracking the resources currently spent on FP services and identifying the resource gap. This would help plan the level of investment required to reduce the unmet need and discontinuation rate. Furthermore, tracking resources for FP services is also crucial in Bangladesh for making policies to attain family planning goals of the 4th Health, Population, and Nutrition Sector Program (4th HPNSP) and improving efficiency in FP resource allocation.10
Despite its enormous importance, there is a dearth of literature on tracking resources spent for family planning services systematically and comprehensively. Track20, a Gates Foundation project, has taken an initiative to track progress in FP towards the goals of FP2020 in many low- and middle-income countries, including Bangladesh. One of the activities of Track20 is to track FP expenditures. Different institutions, such as the World Health Organization (WHO) through its System of Health Accounts (SHA) and the United Nations Population Fund (UNFPA) through the Netherlands Interdisciplinary Demographic Institute (NIDI), attempted to track FP expenditure.11 However, the methods used in those studies were not comprehensive and systematic. This demands introducing better methodologies to improve FP expenditure estimates. Track20 came forward to trace the resources spent for family planning by adapting National AIDS Spending Assessment (NASA) methodology, a comprehensive and systematic method initially developed for tracking HIV/AIDS resources and named Family Planning Spending Assessment (FPSA). Using NASA methodology, FPSA was first conducted in Kenya and Senegal.12 However, this attracted limited attention in the literature, especially in the national context. The only published study using this methodology was restricted to two counties in Kenya.13
The study aims at carrying out an FPSA, which provides the overall picture of the total spending on FP services in Bangladesh during the fiscal year 2018-19 and 2019-20. The study is crucial to understand the FP resource gap and improve efficiency in allocating FP resources to increase the use of modern FP methods, reduce unmet need, and decrease the discontinuation rate. Thus, the findings of the study are useful to formulate policies for achieving the FP-related targets in both 4th HPNSP and Sustainable Development Goals (SDGs).
METHODS
Participants and Procedure
The study uses the customized form of the NASA methodology as a basis for FPSA.14 The NASA approach is a comprehensive and systematic methodology used to determine the flow of resources intended to combat HIV and AIDS. The tool tracks actual expenditure (public, private and international) both in the health and non-health sectors. NASA is expected to provide information that will contribute to a better understanding of a country’s financial absorptive capacity, equity and the efficiency and effectiveness of the resource allocation process. It follows an expenditure tracking system that involves the systematic capturing of the flow of resources by different financial sources to service providers through diverse transaction mechanisms. A transaction encompasses all the elements of the financial flow, the transfer of resources from a financial source to a service provider, which spends the money on different budgetary items to produce functions for the benefit of specific target groups or the general population. It uses both top-down and bottom-up techniques for obtaining and consolidating information. The top-down approach tracks sources of funds from donor reports, committee reports, and government budgets, whilst the bottom-up tracks expenditures from service providers’ expenditure records, facility-level records and governmental department expenditure accounts. As part of its methodology, NASA employs double-entry tables or matrices to represent the origin and destination of resources.15,16
Based on the availability of a complete volume of data on FP expenditure, we concentrated on two fiscal years, 2018-19 (July 2018 to June 2019) and 2019-20 (July 2019 to June 2020). The study covers only the government part, which is the primary source of funding, contributing two-thirds of the fund for FP services.17 According to the FPSA classification, there are three types of entities: financing sources, financing agents that manage the funds provided by the financing sources, and the FP service providers. In general, FP service providers refer to the entities that directly provide the FP services, such as Union Health and Family Welfare Centre (UHFWC), and Maternal and Child Welfare Centre (MCWC). As the central, divisional, district, and upazila level administrations contribute in the provision of FP services, we include the relevant administrative expenditure of all these levels in the service provider category. The inputs of FP services in NASA methodology are categorized into commodities (contraceptives, consumables and related services), management and administration, human resources, activities for enhancing the use of FP services, and FP-related research.
We applied both top-down and bottom-up approaches to trace the expenditure flows of FP services. For addressing the top-down approach we tracked the funds distributed from financing sources to different types of financing agents; and then from financing agents to different types of FP service providers. Similarly, the bottom-up approach involved the assessment of expenditure at the facility level by tracking the funds received from financing agents. Therefore, this study used double-entry techniques to record the flows of funds from the origin to the destination. This resource tracking is very useful for removing the double-counting while calculating the expenditure flows.
Data
The study uses mainly secondary data obtained from the FP wing of the Ministry of Health and Family Welfare (MoHFW), Directorate General of Family Planning (DGFP office), Divisional Office of Family Planning, Deputy Director of Family Planning (DDFP) office, MCWC, and Upazila Family Planning Officer (UFPO) office. In the top-down approach, we collect data from all FP’s operational plans (OPs) except the Maternal, Child, Reproductive and Adolescent Health (MCH) OP. This is because, as per the NASA methodology, FPSA includes expenditure only for contraceptives. We also review Annual Development Programmes (ADP) 2018-19 and 2019-20, and the budget documents of GoB. We used a semi-structured questionnaire to collect data.
In the bottom-up approach, we collected data from the family planning office of all eight administrative divisions. From each administrative division, we selected the median district in terms of the number of eligible couples. Hence, eight districts and eight upazila were included in the sample. We collected data from the DDFP office and MCWC of the selected districts and the UFPO office of the selected upazilas. Table 1 depicts the selected districts and upazilas in this study.
Data Analysis
Using a semi-structured questionnaire, we collected some primary data, especially the time allocation of FP service providers from the MCWC and UFPO offices in all the selected districts and upazilas. Informed consent was sought before interviewing the respondents. The study received ethical approval from the Institutional Review Board of the Institute of Health Economics, University of Dhaka. We extrapolated the results from the bottom-up data of service providers to get the FP expenditure statistics at the national level. For verifying the accuracy of the results, we also attempted to estimate the average FP expenditure of an eligible couple based on the sampled upazilas. And then we extrapolated the results to enable the national level estimation.
RESULTS
The results show that the total family planning expenditures of Bangladesh from government sources in the FY2018-2019 and FY2019-20 are US$262.90 million and US$229.00 million, respectively (Table 2). The results are consistent with the estimation resulting from the FP expenditure based on the number of eligible couples. The study finds that the FP expenditure decreases by US$33.9 million in FY2019-20, which is partly due to the COVID-19 pandemic.
Family Planning Expenditure by Financing Agents
Financing agents decide how much funds to be spent on what items or what categories of service provision. The results show that DGFP is the main financing agent for the provision of FP services in Bangladesh (Table 2). The DGFP manages more than ninety percent of the total FP expenditures (93.3% and 90.1% in the FY2018-19, and FY2019-20, respectively). The FP wing of the MoHFW, the National Institute of Population Research and Training (NIPORT), the Health Engineering Department (HED), and the BAVS maternity hospital manage a very small amount of FP funds.
Family Planning Expenditure by Service Providers
Many providers, including UFPO office, MCWC, BAVS maternity hospital, NIPORT, Mohammodpur Fertility Services and Training Centre (MFSTC), Maternal and Child Health Training Institute (MCHTI), and Family Welfare Visitors Training Institute (FWVTI) provide FP services in Bangladesh (Table 3). The results show that UFPO office at upazila level, which provides FP services mostly through Union Health and Family Welfare Centre (UH&FWC), is the main provider of FP services utilizing more than half (58.75% and 53% in FY2018-19 and FY2019-20 respectively) of FP resources (Table 3). At the district level, MCWC is the key provider of FP services, spending less than one percent of FP resources. At the national level, DGFP is the main service provider, spending one-third of FP resources, followed by the FP wing of the MoHFW, NIPORT, BAVS, MCHTI, MFSTC, and FWVTI.
Family Planning Expenditure by Service Categories
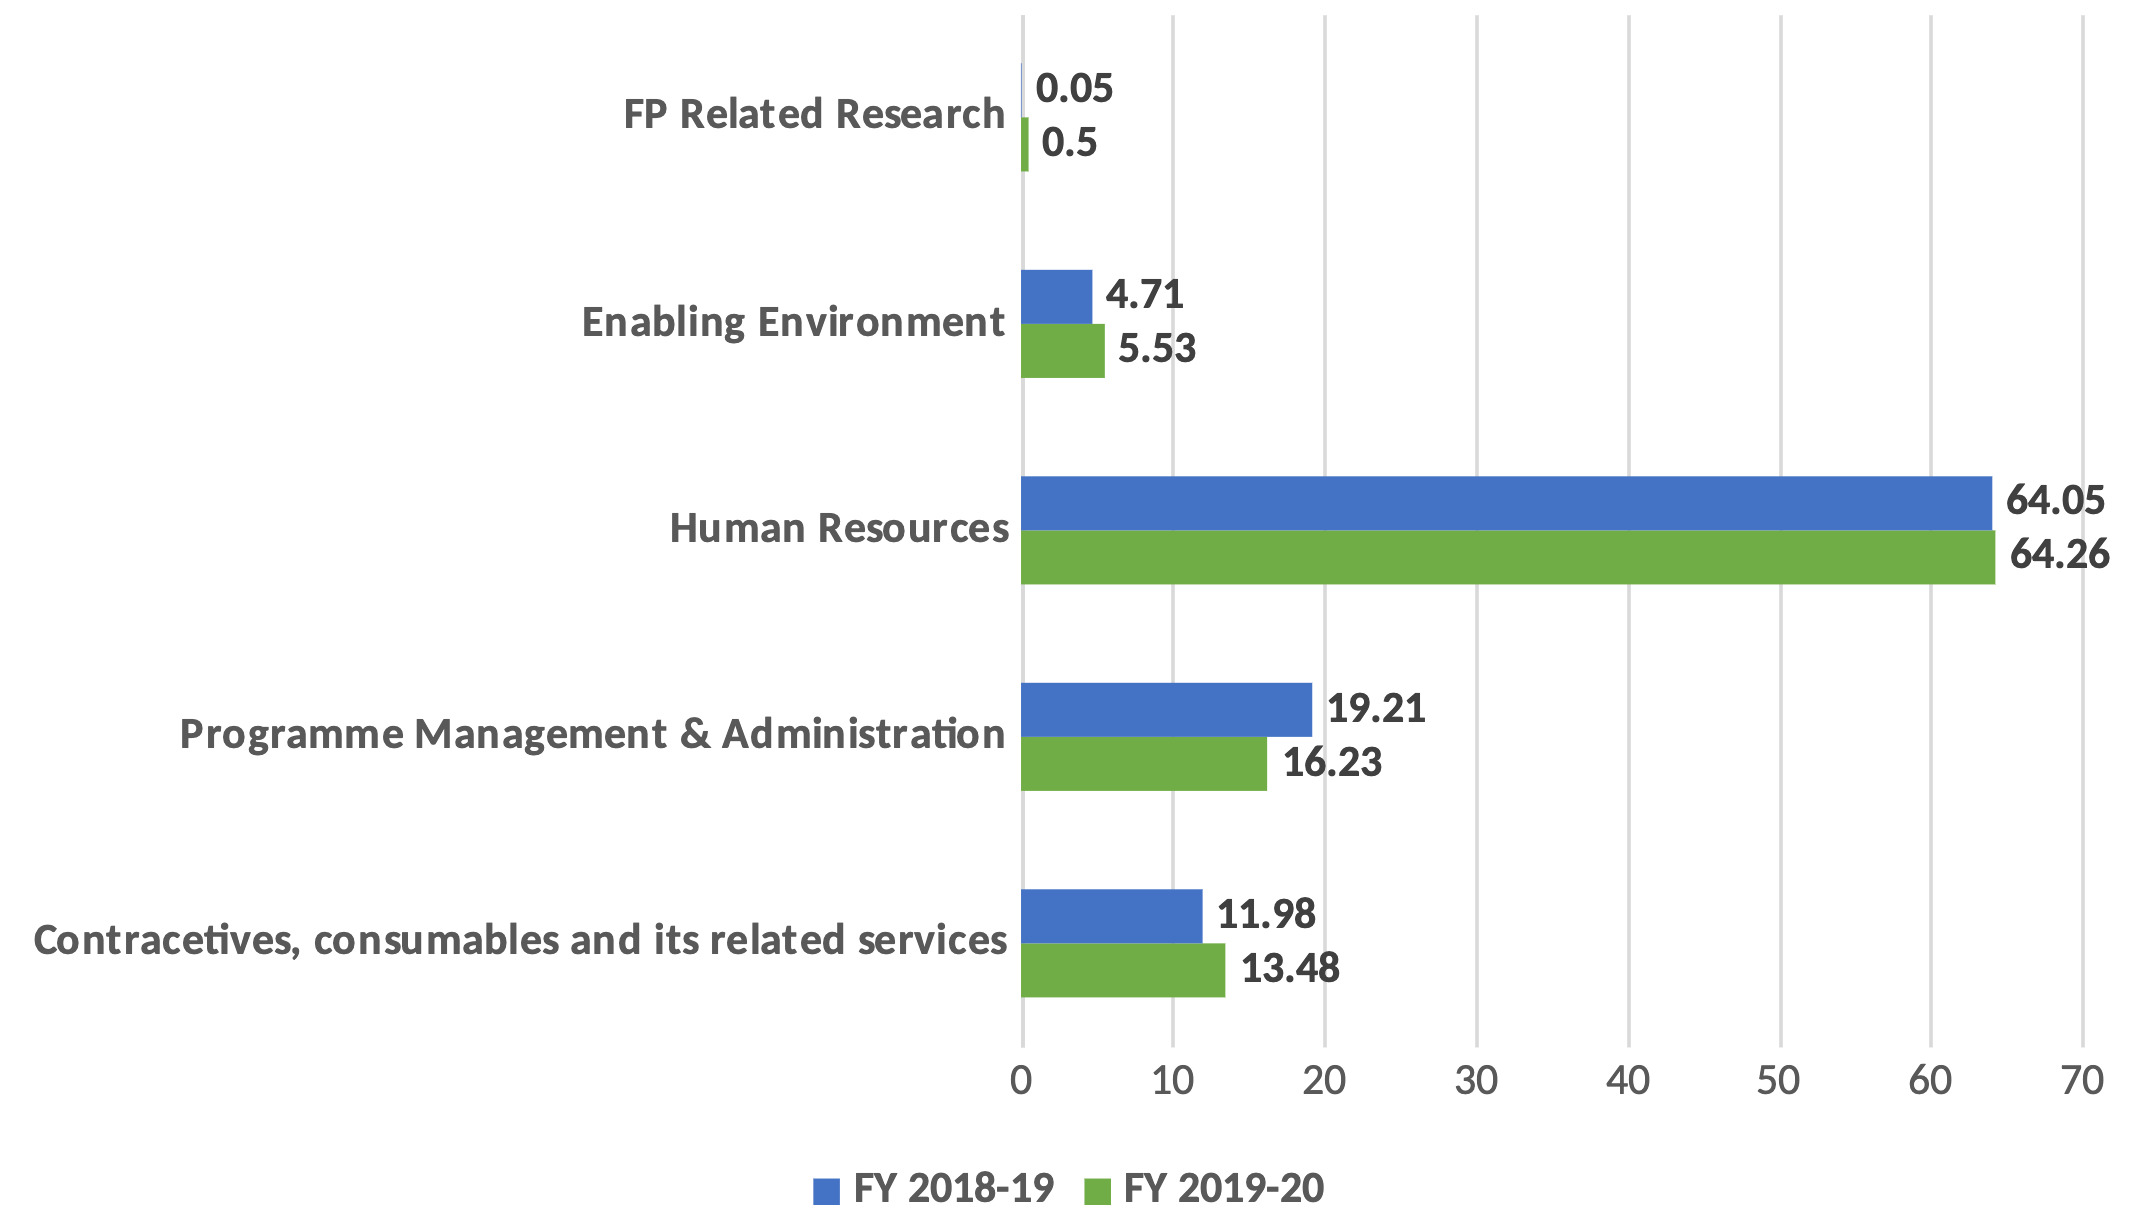
The study categorizes total FP expenditure into five broad service categories, which include contraceptives, consumables and relative services; programme management and administration; human resources; enabling environment for FP services; and FP-related research (Figure 1). The results show that almost two-thirds of the funds allocated for FP services were spent on human resources in both fiscal years, followed by programme management and administration, contraceptives, consumables and related services, and enabling environment. The amount of spending on FP related research is found negligible constituting less than 1% of FP resources in both fiscal years.
Family Planning Expenditure by Inputs
We disaggregate all the recurrent and capital expenditures by input items customizing the FPSA classification of NASA methodology (Table 4). The results show that salary and allowances account for the major share of the total FP expenditure in both fiscal years (60%, and 61%, respectively) (Table 4). Repair and maintenance constitute the second-largest share (3.3% and 5.8%, respectively), followed by pills, implants, and transportation in both years. It is also found that pills, among the contraceptives, hold the largest share of FP expenditure, followed by implants, injectables, and condoms. However, the spending on IUD, NSV, and tubectomy constitutes less than 1% of FP resources. A negligible amount of spending is also found on other vital input items, including monitoring and evaluation, training and capacity building, FP-specific institutional development, and publications (Table 4).
DISCUSSION
The study finds that the estimated FP expenditures of the GoB source (US$229 million in FY2019-20, and US$262.29 million in FY2018-19) is not adequate to achieve the FP-specific targets as planned. It appears that additional US$122.24 million FP funds are needed in FY2022-23 to achieve the targets of 4th HPNSP as per the projection of the Costed Implementation Plan (CIP).18 The spending on family planning is low in terms of both total health expenditure (not more than 4.5%) and GDP (less than 1%). The Ministry of Finance is the main financing source of FP services, contributing two-thirds of the total FP expenditures. The DGFP works as a key financing agent, managing more than 90% of those funds in both years. The UFPO office plays the main role in providing FP services through UH&FWC by utilizing more than half of the resources.
In terms of FP inputs, salary and allowance accounts for the highest share of FP expenditure in both fiscal years, followed by repair and maintenance, pills, implants, and transportation. This is worth mentioning that the spending on LAPM is very low, using US$15.77 million and US$16 million for FY2018-19, and FY2019-20, respectively. The CIP for FP suggests it requires an additional US$24 million per year for increasing the acceptability of LAPM through skilled HR, ensuring counselling on the advantages and side effects of LAPM targeting the young and newly married couples, training on motivation, and counselling.18 The results also show that amount of expenditures on FP-related research (US$0.12 million, and US$1.15 million), and monitoring and evaluation (US$0.34 million, and US$0.13 million) in the FY2018-19, and FY2019-20 respectively, are very negligible.
CONCLUSIONS
The findings of the study may be useful for policy discussions directed toward achieving the FP-related targets of 4th HPNSP. The study results provide a clear understanding of the resource gap for achieving the FP-related targets of the 4th HPNSP. Thus the FPSA may guide the policymakers to make an effective resource plan to achieve FP-related SDGs. The FPSA will also fulfil the knowledge gap in the FP expenditure-related literature. This study provides a baseline for tracking FP funds at the country level. The study results suggest additional allocation for family planning-related research to identify the factors behind the unmet needs and discontinuation of family planning methods. The study advocates for more resource allocation for enabling the environment to increase the utilization of modern methods. Allocation of additional funds is also crucial for monitoring and evaluation and awareness-building activities to increase the contraceptive prevalence rate (CPR).
The study’s main limitation is that it could not capture, due to resource constraints, the entire gamut of FP expenditure by including the development partners, NGOs, and private spending. Future research can explore the whole picture of FP expenditure, including all financing sources and agents.
ACKNOWLEDGMENTS
The authors sincerely express their sincere gratitude to the Avenir Health, for funding the study. The authors are also owed to the respondents who participated in the survey by providing their valuable time.
FUNDING
This work was supported by the Avenir Health which is implementing Track20 project with funds from the Bill and Melinda Gates Foundation. All opinions, judgments and policy inferences implied in the document are however the authors’ own and do not necessarily reflect the views of the funding agency.
AUTHORSHIP CONTRIBUTIONS
RA analyzed the data and drafted the manuscript. NS and NIT apprehended the study design, coordinated the study, and critically revised the manuscript. SI and SAH critically revised the manuscript. All authors reviewed and approved the final manuscript for publication.
COMPETING INTERESTS
The authors completed the Unified Competing Interest form at http://www.icmje.org/disclosure-of-interest/ (available upon request from the corresponding author), and declare no conflicts of interest.
CORRESPONDENCE TO
Md. Ragaul Azim, Lecturer at Institute of Health Economics, University of Dhaka
Postal Address: 4th Floor, Arts Building, Institute of Health Economics, University of Dhaka, Dhaka 1000, Bangladesh; azim.ihe@du.ac.bd; iheazim63@gmail.com