
SARS-CoV-2 is an RNA virus transmitted predominantly through respiratory droplets, and its high dissemination capacity has rapidly turned it into a global public health threat.1,2 The first cases were identified in late December 2019 in Wuhan, China. On March 11, 2020, after it spread to more than 100 countries and thousands of reported deaths, the World Health Organization (WHO) declared COVID-19 a pandemic.3,4
SARS-CoV-2 exhibits continuous emergence and replacement of variants, with an estimated evolutionary rate of approximately 1.1 × 10⁻³ substitutions per site per year.5 Although its evolutionary dynamics and clinical impact have not been fully characterized, viral mutations and immune pressure generated by vaccination and prior infections can modify the clinical presentation and complicate the diagnosis and management of COVID-19.6 In Mexico, few studies have compared these changes across epidemic waves using primary care and hospital-based data. This study addresses this gap in a city with intense cross-border mobility and significant structural challenges. Beyond describing clinical trends, examining how disease severity shifted across pandemic waves provides critical insights into health system demand, allocation of hospital and critical care resources, and preparedness in high-mobility, resource-constrained settings.
This study aimed to characterize temporal changes in clinical severity and symptomatology across six COVID-19 waves using primary data from units of the Mexican Institute of Social Security (IMSS) in southeastern Mexico, and to examine their correspondence with national patterns of variant predominance and vaccination coverage, with implications for health system planning and policy decision-making. Understanding these variations is essential for public health planning, particularly in border regions characterized by limited resources and high population mobility.
METHODS
We conducted a descriptive time-series study from March 1, 2020, to January 6, 2023, integrating clinical information from confirmed COVID-19 patients treated at the General Zone Hospital No. 1 and at Family Medicine Units 01 and 11 of the IMSS in Tapachula, Chiapas, Mexico.
Demographic, clinical, and epidemiological data were obtained from medical records, epidemiological case report forms, and the Online Epidemiological Surveillance Notification System (SINOLAVE). Only patients with confirmed diagnoses by RT-PCR or rapid antigen tests were included. Both ambulatory cases and those requiring prolonged observation or hospitalization were considered. Records that were duplicated, inconsistent, or had missing information in key variables were excluded.
Confirmed cases were classified into six waves based on the official IMSS epidemiological definition7,8:
Wave 1: March 4–October 10, 2020
Wave 2: October 11, 2020–March 27, 2021
Wave 3: March 28–October 9, 2021
Wave 4: October 10, 2021–March 19, 2022
Wave 5: March 20–October 8, 2022
Wave 6: October 9, 2022–January 17, 2023
The predominant variant in each wave was inferred by temporal alignment with national genomic surveillance data available through March 15, 2023.9 Individual genomic sequencing was not performed. This approach has been used previously in national analyses of the pandemic. Individual vaccination status was not available; national vaccination coverage percentages were not used for statistical adjustment or individual-level inference but were used exclusively for contextual interpretation and were not incorporated into individual-level analyses or policy modeling.
A descriptive and comparative analysis was performed using Pearson’s chi-square test or Fisher’s exact test, with the assumptions for each test verified. Bonferroni correction was applied for multiple comparisons. Given the descriptive nature and complete census of recorded cases in participating units, confidence intervals were not calculated. Trends across waves were estimated (p-trend). Missing data were handled through listwise deletion. Analyses were conducted using IBM® SPSS® Statistics version 24. The study was reviewed and approved by the Local Health Research Committee 703 and the IMSS Research Ethics Committee in Chiapas, which granted a waiver of informed consent due to the exclusive use of secondary, non-identifiable data and assigned the registration number R-2022-703-025.
RESULTS
Of 18,319 suspected cases, 13,045 (71.2%) were tested; of these, 6,145 (47.1%) were confirmed positive for SARS-CoV-2.
Demographic and clinical characteristics
Among confirmed cases, the sex distribution was similar; the most common occupation was “employee,” and most patients were between 20 and 59 years of age. Of the 6,145 confirmed patients, 1,079 (17.5%) required hospitalization, 647 (10.5%) required supplemental oxygen, and 432 (7.0%) were intubated. Among intubated patients, 400 (92.6%) died (Table 1).
The reduction in case severity coincided temporally with the national COVID-19 vaccination strategy, which reached 81.9 million adults aged 18 years or older between December 2020 and December 2021.10,11 Mexico achieved approximately 65% vaccination coverage in 2021, increasing to 76.1% in 2022. Multiple national analyses have documented that as vaccination coverage increased, COVID-19 cases and mortality declined, regardless of vaccine platform11 (Figure 1).

Changes in symptomatology by wave
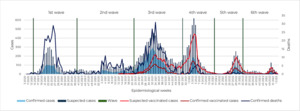
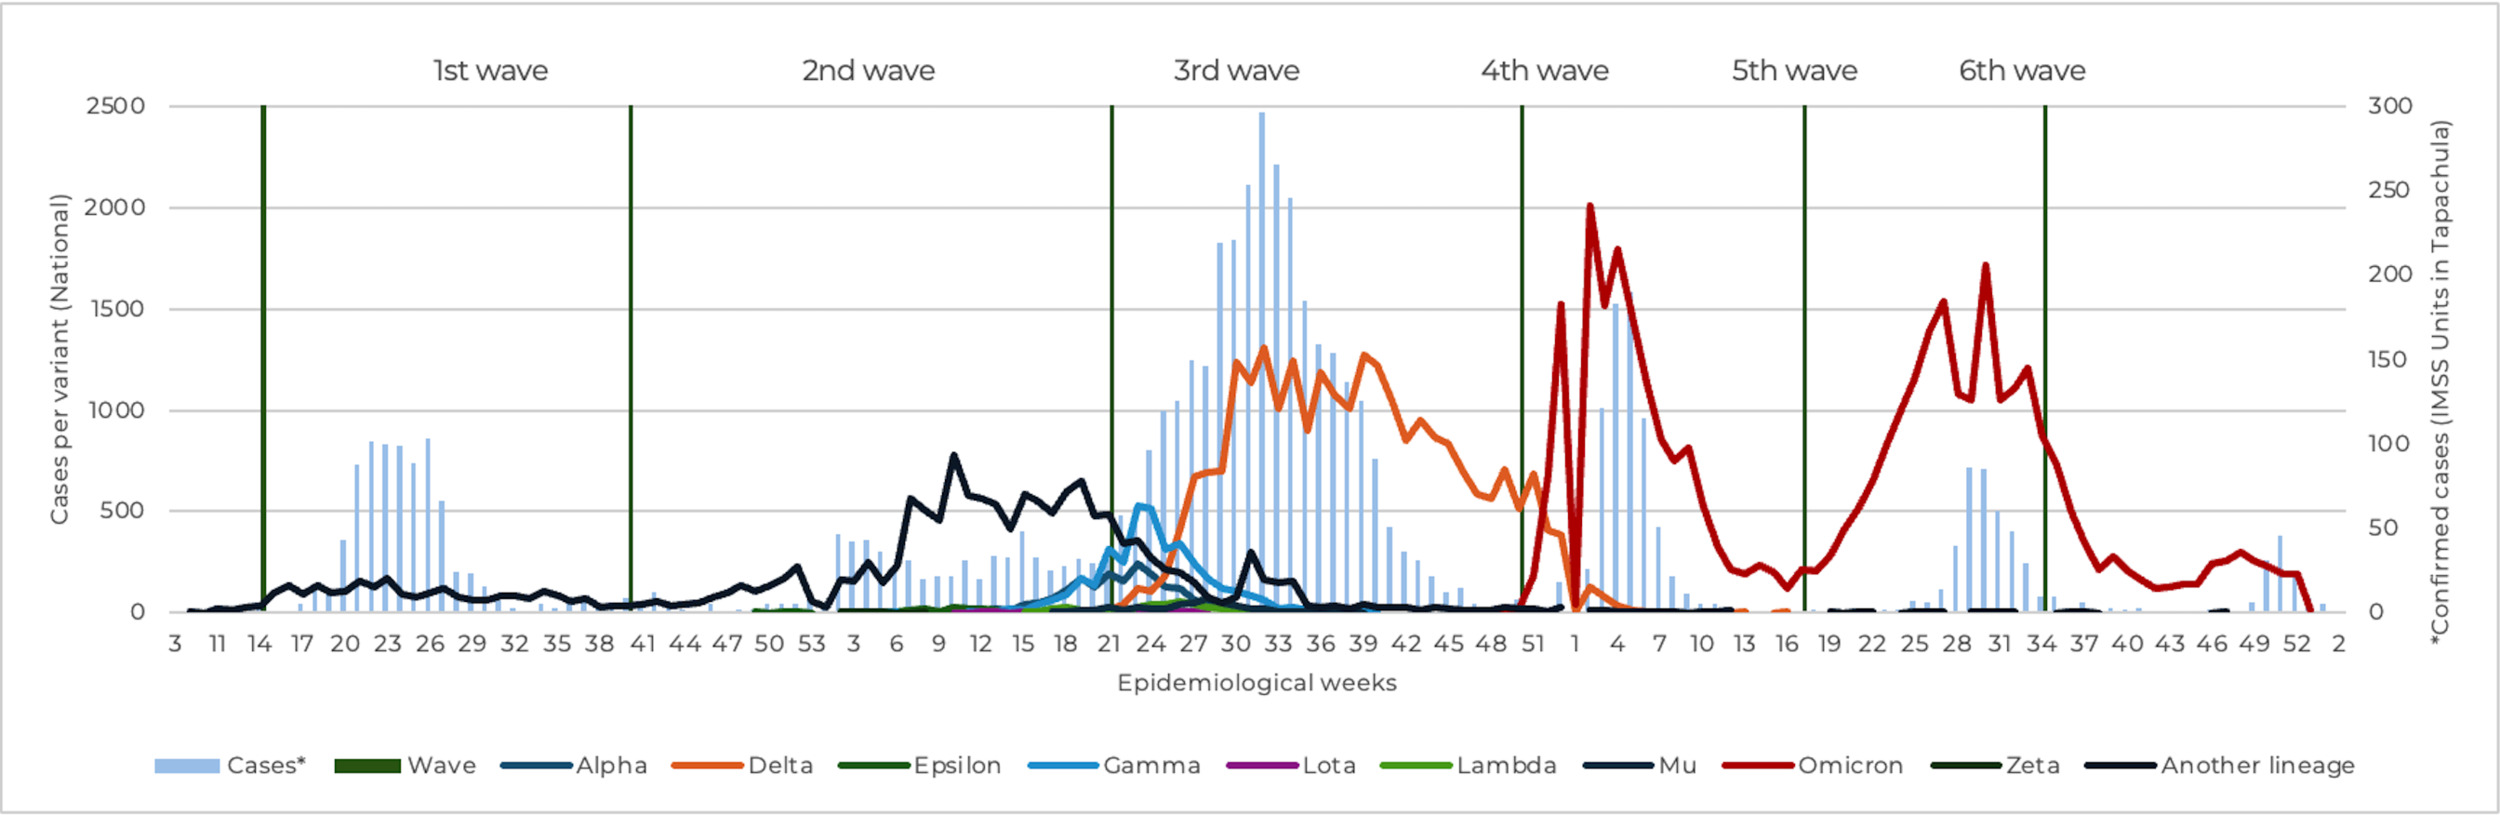
In this study, 52.2% of cases occurred during the third wave. Unspecified lineages predominated in the first and second waves; the third wave was dominated by Delta, and Omicron predominated from the fourth wave onward. Thus, the highest number of cases coincided temporally with the predominance of the Delta variant (Figure 2).
Changes in severity and outcomes
The most common symptoms were cough, headache, fever, myalgia, arthralgia, chills, and malaise. As shown in Table 2, symptoms such as chest pain, dyspnea, tachypnea, cyanosis, prostration, abdominal pain, and diarrhea—along with indicators of greater severity, including supplemental oxygen requirement, endotracheal intubation, and death—were predominantly observed in the first three waves and decreased gradually through the sixth wave. Most symptoms trends across waves were statistically significant.
DISCUSSION
Interpretation of main findings
Severe disease and mortality were concentrated in the first three waves, coinciding temporally with the predominance of unspecified lineages in waves 1 and 2 and of the Delta variant in wave 3. This pattern is consistent with national and Latin American studies documenting greater virulence and higher viral loads during the early phases of the pandemic.12,13 The progressive decline in severe symptoms, oxygen requirement, intubation, and mortality from the fourth wave onward reflects an epidemiological shift widely described following the spread of Omicron and the increase in vaccination coverage.14,15 These shifts translated into substantial changes in demand for hospital beds, oxygen therapy, and intensive care services across waves, directly affecting health system capacity and operational resilience.
The extremely high mortality among intubated patients (92.6%) warrants particular attention. Most of these interventions occurred during the first three waves, when late hospital presentation, saturation of intensive care services, and the intubation criteria used during that period may have contributed to poor outcomes. Similar trends have been reported in other studies in Mexico and Latin America; however, the magnitude observed here suggests the need for targeted investigations into critical care practices and resource availability during the early stages of the pandemic.
Comparison with the literature
Our findings are consistent with previous analyses in Mexico that describe higher incidence and mortality during the first waves, followed by a transition to milder clinical presentations after mass vaccination and the emergence of Omicron.7,11 International studies have similarly shown that Delta was associated with an increased risk of hospitalization and death, whereas Omicron was linked to a substantial reduction in clinical severity, regardless of population immunity levels.16,17
The symptomatic pattern observed in this study —decreasing dyspnea, tachypnea, and cyanosis, with a relative increase in upper respiratory symptoms— has also been documented in multiple regions following the displacement of variants with greater affinity for the upper respiratory tract.18–20
Potential explanations for observed trends
The evolving clinical patterns documented here may be explained by the interaction of several factors:
-
Higher vaccination coverage, with robust evidence of reduced risk of hospitalization and death across vaccine platforms.
-
Hybrid and accumulated immunity, resulting from prior infections, which lowers the likelihood of severe disease even with new variants.
-
Changes in Omicron’s viral tropism, characterized by lower pulmonary replication and greater replication in the upper airways, as demonstrated in ex vivo studies and animal models.
-
Improvements in clinical protocols, accumulated medical experience, and institutional learning processes likely contributed to better outcomes over time, although the high mortality among intubated patients highlights structural limitations in critical care capacity during early pandemic phases.
Strengths and implications
This study provides robust, real-world evidence on how pandemic waves translated into changing clinical severity and healthcare demand in a high-mobility border region with limited resources. By integrating data from primary and secondary care, our findings inform health system planning, surge capacity management, and prioritization of critical care resources. These results are particularly relevant for policy-makers and health system managers in similar settings facing recurrent epidemic threats.
Limitations
This study relies on the temporal correspondence between waves and nationally predominant variants; because individual genomic sequencing was not performed, causal associations between variants and severity cannot be established. The lack of individual vaccination data limits analysis of protection by dose number or vaccine platform. Variability in diagnostic and testing criteria across units may also have occurred. Underreporting during epidemic peaks is possible. As with all descriptive time-series studies, risks of misclassification, clinical heterogeneity across units, and limitations inherent to the use of secondary data persist.
CONCLUSIONS
The clinical severity of COVID-19 showed a sustained reduction across six waves, paralleling the displacement of more virulent variants and the increase in population immunity. The experience documented in this region highlights the need to strengthen diagnostic capacity, epidemiological surveillance, and the infrastructure of both primary and hospital care systems to improve preparedness, resource allocation, and policy response for future public health emergencies, particularly in high-mobility and resource-limited regions.
Ethics statement
The study was reviewed and approved by the Local Health Research Committee 703 and the IMSS Research Ethics Committee in Chiapas, which granted a waiver of informed consent due to the exclusive use of secondary, non-identifiable data and assigned the registration number R-2022-703-025.
Data availability
The databases generated and/or analyzed for this study are available from the corresponding author upon reasonable request.
Funding
The study did not have any source of funding; all expenses were covered by the authors and their respective employment salaries.
Authorship contributions
OMDC, CMG, RBC, JCJG, KRNF, HARL – conceptualization and submission to evaluation. OMDC – investigation. OMDC, ESMN, HARL, KRNF – data curation, visualization. OMDC, CMG, JMCG, RBC, VMCA, ESMN, KRNF, HARL – formal analysis, writing of the original draft; all authors contributed to reviewing and editing.
Disclosure of interest
The authors completed the ICMJE Disclosure of Interest Form (available upon request from the corresponding author) and disclose no relevant interests.
Correspondence to:
Karla Reyna Navarro-Fuentes
Epidemiology Service, Family Medicine Unit No. 11, Mexican Institute of Social Security
Carretera Costera y Anillo Periférico S/N, Col. Centro. Tapachula, Chiapas
Mexico
karla.navarro@imss.gob.mx; nkarla@hotmail.com