Household hunger remains a critical public health challenge in urban setting, especially in low and middle income country like Kinshasa.1 It is defined as household food deprivation resulting from a lack of resources, whose main causes are economic, unequal access to resources, and poverty.2 Hunger is the most severe forms of household food insecurity3,4 hunger has wide-ranging consequences that harm health, physical grow, children’s cognitive development and academic performance.5,6
World Food Program (WFP) estimated in 2024 that 20% of households worldwide experienced hunger, and projections suggest that by 2030 around 8% of the global population will still be affected despite commitments to the Sustainable Development Goals.7 In the Democratic Republic of Congo (DRC), hunger is particularly severe, 2024 UN surveys and IPC (Integrated Food Security Phase Classification) in DRC found that one-quarter of the population faced hunger, and a 38% rate of severe food insecurity.8,9 Earlier data from 2020 showed a 40% prevalence of food insecurity and hunger in Kinshasa.9–12 Despite the high prevalence of household hunger, local evidence is limited in Kinshasa. In march 2025, the IPC reported that about 35% of household in Kinshasa were affected by hunger.13 Although this national survey provides important country benchmarks for HHS(HouseholdHungerScale), those aggregates mask substantial within-city and within-health-zone variations, with studies showing significant variations between neighborhoods in Kinshasa. Rapid urbanization, fast population growth, informal economy and seasonality were identifying as major hunger causes in the zone.14
This study bridged some gaps, we apply the Household Hunger Scale to a three-stage probability sample representative of Mont Ngafula II, an urban–rural health zone in Kinshasa. This study provides the first health zone–level estimates of household hunger in the area and links local hunger prevalence to children’s nutritional status, feeding practices, and household sociodemographic factors. Survey-weighted and multivariable analyses generate locally disaggregated, policy-relevant evidence that complements national reports such as the IPC in the DRC and supports targeted interventions to improve household living conditions.
2. METHODS
2.1. Study Design and Sampling Study design and Setting
A cross-sectional household study was conducted between November and December 2024 in the Mont Ngafula II health zone one of 35 healths zones in Kinshasa. It is located in west of Kinshasa. It has fourteen health areas. This health zone extends about 152.6 km² and an estimated population of 336 85. Household food vulnerability in this health zone is shaped by rapid urbanization which reduce local food production, increasing dependence on import reliance; fast population growth, informal economy, socioeconomic pressures and strong seasonal. Seasonal constraints on market gardening, climate-related disruptions, and associated increases in food prices, along with higher disease burden and healthcare costs, reduce households’ food access.14,15
Study participants
All households in the health areas of Mitendi, Sans fil, Matadimayo, Matokoma, Kimbwala in Mont Ngafula II health zone with at least child 6-59 months aged.
Sample size and sampling procedure
A three-stage probability sampling approach was used : (1) involving random selection of 5 health areas ; (2) proportional selection of enumeration areas ; and (3) systematic sampling of households. The sample size was calculated using the Schwartz formula, assuming a prevalence of 72.7%, 95% confidence, ±5% precision, and a design effect of 1. Sampling weights were calculated as the inverse of selection probabilities, adjusted for non-response and post-stratified to known household distributions. Analyses applied survey weights and accounted for clustering at the enumeration area level and stratification by health area, with variances estimated using robust Taylor series linearization methods.
Data collection tools and procedures
Data were collected through household visits using questionnaires containing Fanta item of HFIAS(Household Food Insecurity Access Scale) was administered by trained interviewers. Information gathered included household hunger, socioeconomic characteristics, child diet diversity (using a 24-hour recall of foods consumed the previous day by eight FAO food groups) and anthropometric measurements were taken by weight, height/length and age, following WHO protocols.16 Records without outcome data were excluded from the analysis. To maintain its consistency, the questionnaire was first prepared in French and translated into Lingala and then back translated to French, and pre-tested. Interviewers received five days of training, and daily quality checks ensured data accuracy.
Operational definitions and measurements
Household hunger: Household that had experienced food privation occurring within the previous 4 weeks’ food assessed using the Household Hunger Scale (HHS) derived from HFIAS was used to estimate the percentage of households affected by 3 differents severities of household hunger: (1) No to mild household hunger (HHS score 0−1); (2) Moderate household hunger (HHS score 2−3); and (3) Severe household hunger (HHS score 4−6and)17–19 Independent variables included child characteristics such as age group (6–23, 24–41, and 42–59 months), sex, MUAC (<125 mm or ≥125 mm), and nutritional status indicators (stunting, wasting, and underweight), defined as low height-for-age, weight-for-height, and weight-for-age, respectively. Children were classified as stunted, wasted, or underweight if their z-scores were <−2 standard deviations, based on WHO growth standards adjusted for sex; otherwise, they were considered well nourished. Anthropometric measurement: Child length was measured to the nearest 0.1 cm using a stadiometer movable head length-boards (in recumbent or standing position). Weight was measured to the nearest 0.1 kg using a SECA electronic battery-powered personal scale with the child minimally clothed. Sociodemographic variables included household head education (<secondary or ≥secondary), employment status (Employed/unemployed), household size (≥6 members), number of meals per day (≥3), daily food expenditure (>1.25, 1–1.25, or <1 USD), and household’s wealth index was constructed using principal component analysis to categorize in to rich, middle and poor. Child dietary diversity score (DDS) was determine by FANTA-WHO, DDS where the respondent was asked to list all food items consumed by the child in the previous 24 h ahead of data collection. Then, the listed food items were grouped in to seven food groups Namely grains, roots and tubers, legumes and nuts; dairy products (milk, yogurt, cheese); flesh foods (meat, fish, poultry and liver/organ meats); Eggs, Vitamin-A rich fruits and vegetables and other fruits and vegetables. considering at least five food groups as the minimum acceptable dietary diversity, a child with a DDS of less than five was classified as inadequacy dietary diversity.18,19 Children’s ages were obtained from caregiver reports or verified using birth certificates. To ensure consistency among enumerators, a standardized training program was conducted, followed by assessments to evaluate accuracy and consistency before data collection. Data were collected using smartphones programmed with SurveyCTO version 2.81.3 and securely stored on the Kinshasa School of Public Health server.
2.2. Statistical Analysis
Data was coded, cleaned, and entered in to Excel version 16 and then exported to Stata version 18 for further analysis. Anthrometrics indices were computed using the WHO Anthro software, version 3.2.2. Sample characteristics were described with frequencies and prevalence estimates of household hunger were calculated. Pearson chi-square tests assessed bivariate associations. multiple regression models were used to estimate adjusted odds ratio (aOR) with 95% confidence intervals for factors associated was computed to assess the strength of the association. A p-value of < 0.05 was used to determine statistical significance in the multivariable analysis. The Hosmer and Lemeshows goodness of fit-test was run to check the fitness of the final model for the three separate models
2.3. Ethics statement
This study was approved by the ethics committee of the Kinshasa School of Public Health, University of Kinshasa, under approval number ESP/CE/39B/2024 dated November 24, 2024. Informed consent was obtained from all participants involved in this study.
3. RESULTS
The results were presented in section.
Section I. Household Hunger prevalence and Sample Characteristics
The study included 583 households. Among them, 3.8% (95% CI: 2.5–5.7) experienced severe hunger, 32.4% (95% CI: 28.7–36.3) had moderate hunger, while about 63.8% were food secure. Children were divided into three age groups, with those aged 24–41 months being the most represented, boys outnumbered girls and one in five children had Muac< 125 mm. Most children had inadequate dietary diversity. The majority of household heads had at least secondary education, unemployed, married, and attended revival churches. Most households lived on less than USD 1.25 per person/day, consumed fewer than three meals per day, and were not wealthy (See table 1)
Section II. Factors associated with household hunger
1. Bivariate associated
Overall, 36.19% of households experienced hunger, while 68.81% were food secure. In unadjusted analyses, most sociodemographic factors, child dietary diversity and child nutritional status showed significant associations with household hunger. However, child sex, child age, underweight, stunting, Muac, marital status, and religion were not significantly associated (p > 0.05).
2. Multiple Regression (Primary Model)
After adjustment, Overall, 32.4% of household experienced moderate hunger while 3.8% severe hunger. After adjustment, children with inadequate dietary diversity trended to suffer from hunger (aOR= 1.58; 95% CI: 1.03–2.44). Those from household hunger had a 2.6-fold higher risk of wasting (aOR = 2.6; 95 %: CI 1.65–8.24), were much more likely to be underweight (aOR=7.1; 95 % CI: 2.4; 22). Households with head unemployed (aOR = 2.5; 95% CI: 1.4-4.27), were poor (aOR = 4.4; 95% CI: 2.3-8.5), spent less than 1 us dollar per person for meal (aOR = 3.3; 95%IC :1.5-7.3), consumed fewer than three meals per day (aOR = 4.8; 95% CI: 1.9-11.8), and a large household size (aOR = 1.85; 95% CI: 1.23-2.77) were significantly more vulnerable to hunger.
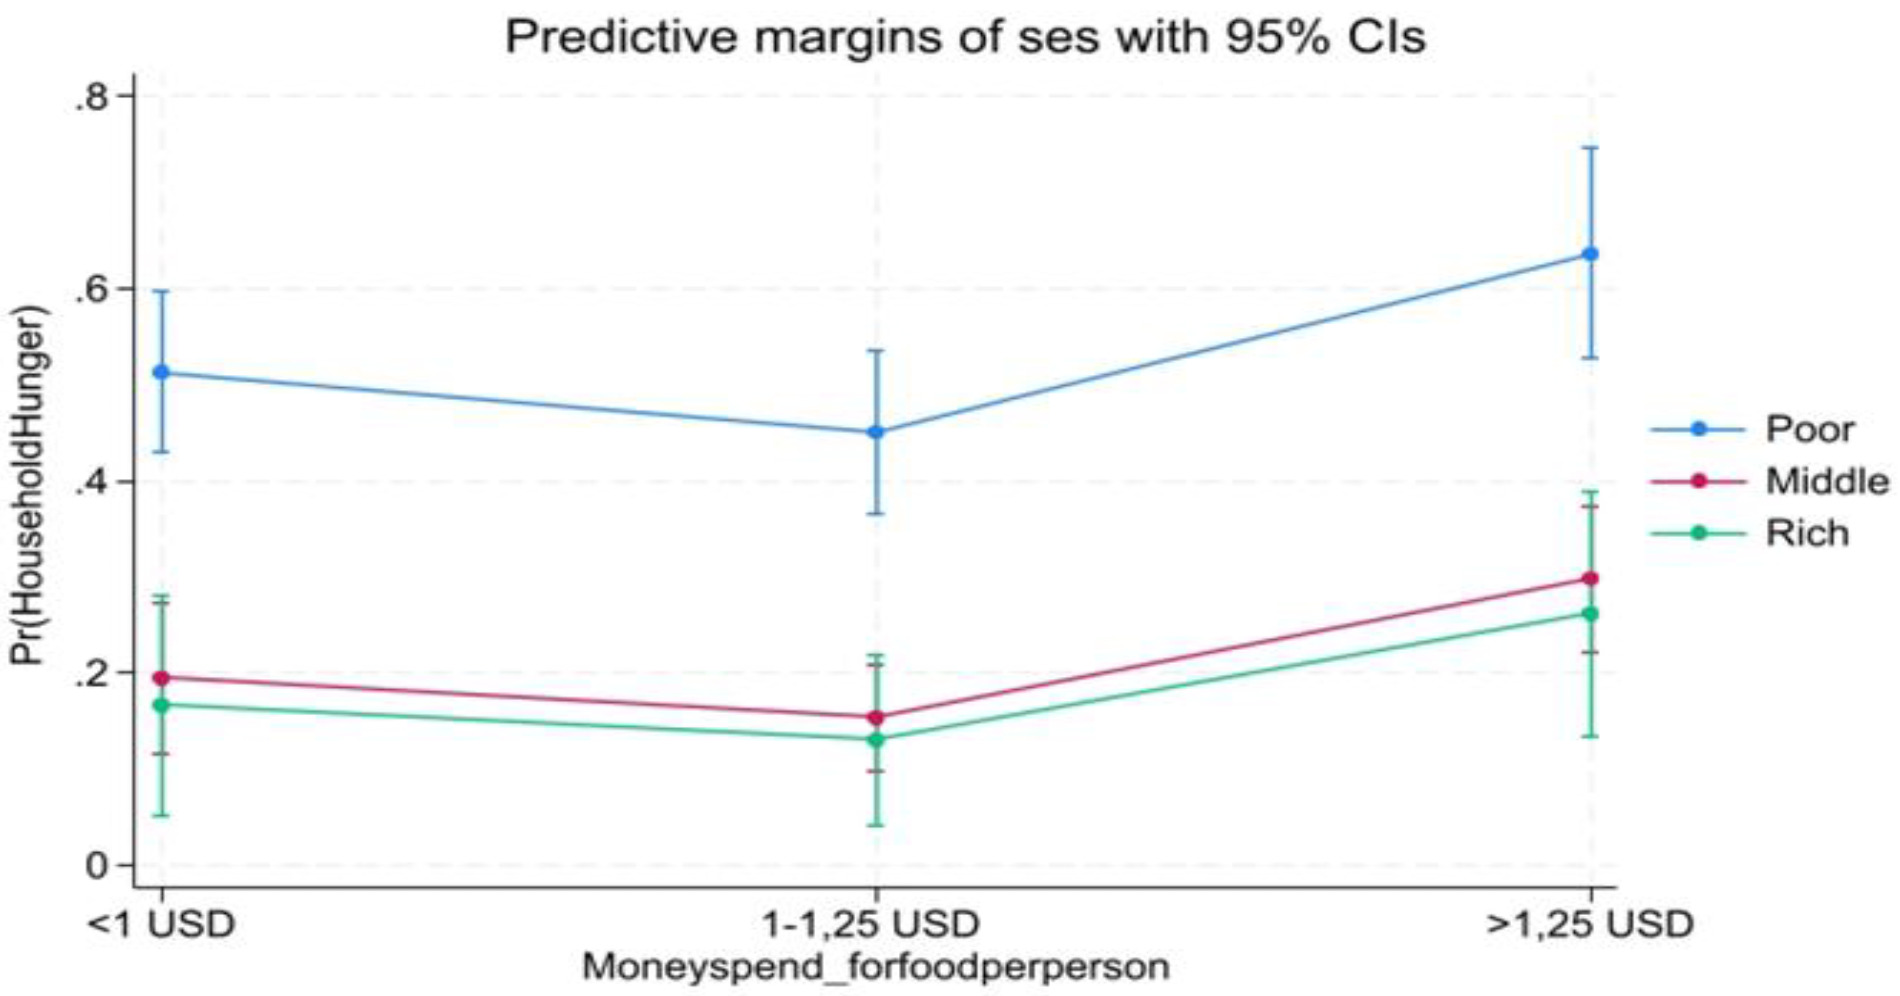
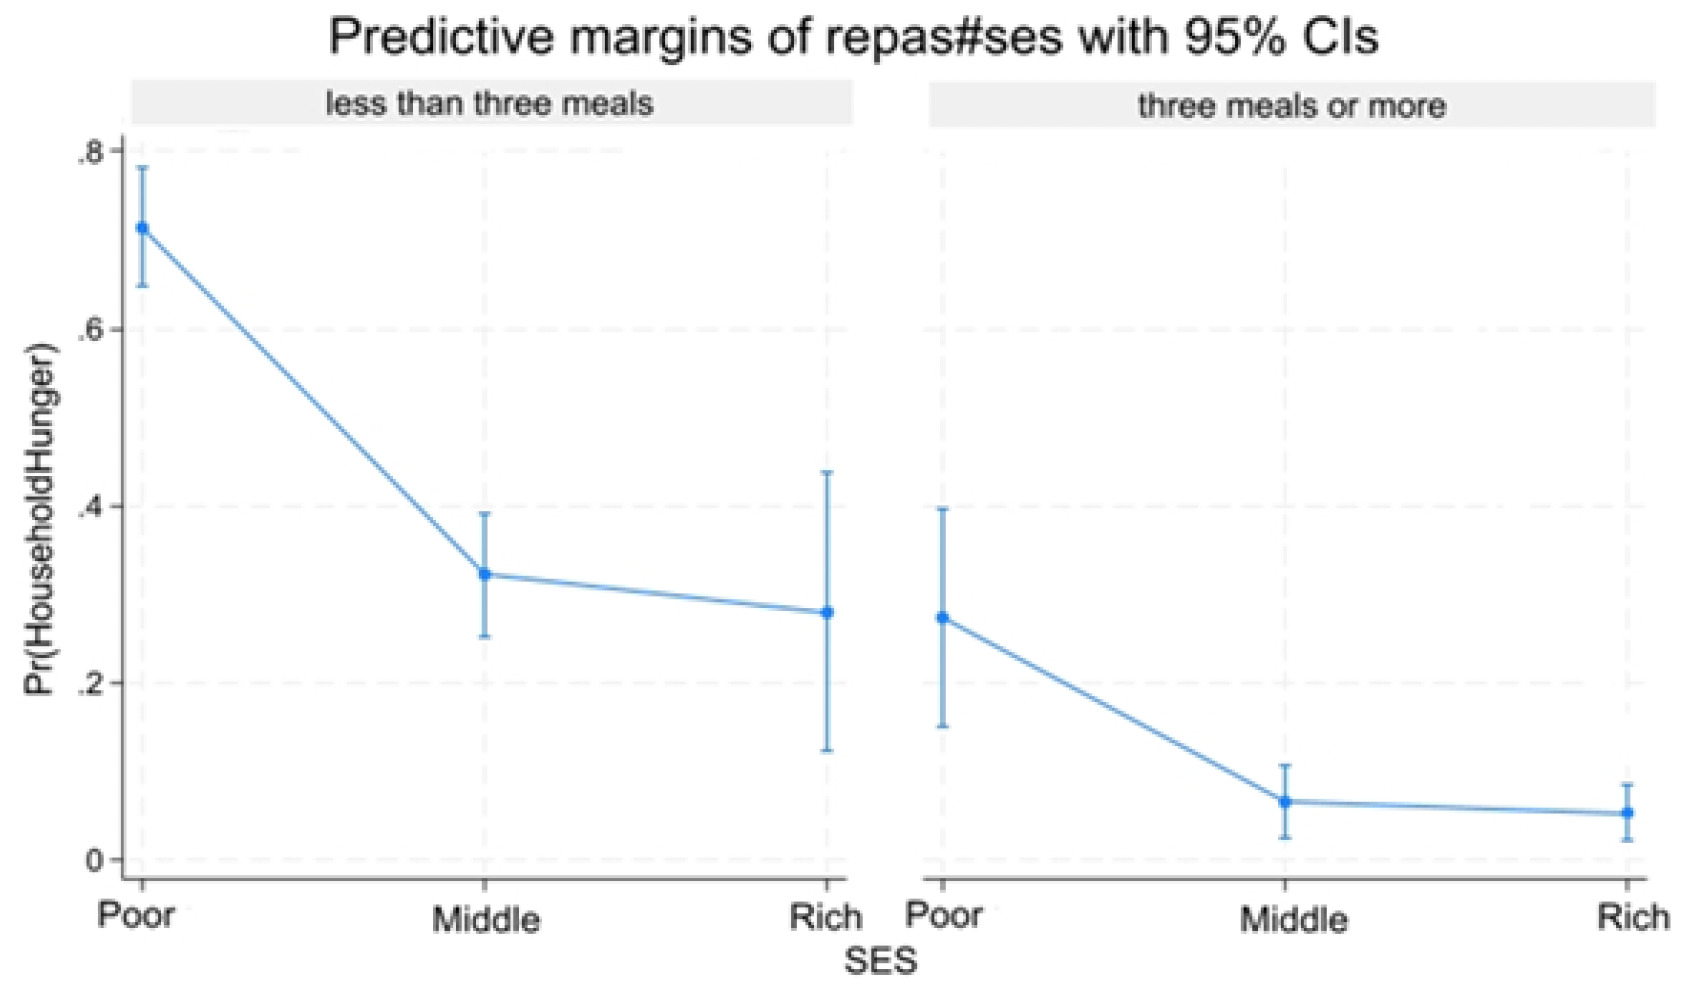
3. Predict Probabilities and Interaction Analyses
Socio-economic level and Household hunger: Predictive margins by money spend for meal per individual/day and meal’s number. Predictive margins of household hunger (Pr (HOUSEHOLD HUNGER)) change by SES and Meal.


Discussion
Study aim was to determine the household hunger prevalence and its associated factor. The study showed a visible, graded link between several factors such sociodemographic, economic, child dietary diversity and child nutritional status factors. The poorest household were around 2.3 times more likely to suffer from hunger than wealthiest household. Currently, wasting, being underweight, unemployment of the household head, households with six or more members, households consuming fewer than three meals per day, households spending less than one US dollar per person/ day on food, and households with the poorest socioeconomic status were strongly independently correlated with food secure. Together these results reinforce a well establish pathway linking poverty to compromised household life, in order to fall to a level of poverty outcomes. These insights underscore the importance of context specific research in informing public health strategies and educational policies, while paving the way for future studies that emphasize the interrelated roles of sociodemographic, economic, nutritional, and dietary diversity factors in household survival, there by supporting the development of targeted interventions.
In the present study, 32.4% of household experienced moderate hunger while 3.8% severe hunger. It is difficult to make a comparison due to the different indicators used in Sub-Saharan and southern Africa.7,20 Lower household hunger mean scores than ours were reported in a study conducted in the central Kasai province, also in the DRC.21 This could be explained by irregular meal patterns and a delay investment in household hunger interventions at Kinshasa. Moreover, the high prevalences of hunger have been reported in numerous studies worldwide, notably in Tanzania, where the prevalence was nearly twice that observed in our study, as well as in Guyana.22,23 However, with this prevalence in certain areas, DRC will have difficulty achieving the sustainable development goal (SDG) number two.10
Poor feeding practices among under five children was strongly associated with household hunger. This challenge is a public health concern in low and middle income country. Our result was similar to those from Nigeria and Nepal.24,25 To address this challenge, several countries have implemented intervention such as flats chicken garden, cultivation of fruit trees in plots, household nutritional education program and a small-scale nutrition-sensitive agriculture in urban areas.26
The study reported that the majority of household heads were unemployed, reflecting the high unemployment rate in the Democratic Republic of Congo, which adversely affects household income, socioeconomic status, and access to sufficient and nutritious food.7,15,27 Most households spent less than one US dollar per person per day on food, indicating widespread extreme poverty, a finding supported by a 2024 World Bank report indicating that 73.5% of congolese people live on less than 2.15 US dollars per day.28 Additionally, large household size was significantly associated with increased household hunger, as higher food needs place a greater burden on economically vulnerable households.2,29–31 These results are consistent with findings from studies conducted in the DRC, Ethiopia, Zambia, and other sub-Saharan African countries.26,29,32
Our study indicates a negative association between a child’s age and sex with hunger. This was similar to research performed in Kinshasa and contradicts what is known in the literature, namely that the older the child, the more likely they are to be developmentally without hunger.25 This observation in the present study could be explained by several contextual factors that have been highlighted in the literature. First, breast feeding, second children in younger age groups receive more parental attention, particularly in terms of care and stimulation, compared with older children, who are assumed to be less vulnerable33,34 Also, younger children receive slightly more integrated health services (vaccination, CPS), providing them with access to essential health, nutrition, and development interventions11,35
Wasting and underweight were often reflecting no food access or privation food conditions (hunger). The association observed in this study between wasting, underweight and household hunger may be explained by inadequate and poor-quality food intake, limited resources leading to poor dietary practices, and common illnesses such as diarrhea, malaria, and anemia. Similar findings have been reported in studies conducted across Africa and other parts of the world.32,36 It is important to approach this relationship with caution, as the evidence for causality with household hunger.32
Our results demonstrate the importance of adopting integrated and equitable strategies in policies and programs. However, this study has certain limitations.
Strengths and limitations
This study is among the few in the DRC to assess household hunger in families with children aged 6–59 months, examining the combined influence of socioeconomic factors, feeding practices, and child nutritional status. Its focus on an urban–rural context strengthens the relevance of the findings for targeted interventions. The study is further strengthened by rigorous methodology, including representative sampling, standardized nutritional and hunger measures, validated assessment using WHO-FANTA validated tool, and sensitivity analyses that support the robustness of the results.
As this is a cross-sectional study, it was not possible to establish causal and/or temporal associations including potential recall bias related to household reporting the lack of information on the quantity of food consumed by children. The sample size is sufficient for first analysis, but it may not fully reflect the population’s diversity. Selection bias may arise when some groups are inadequately represented or when specific demographic segments encounter obstacles to participation. We acknowledge that the IDDS represents the previous day’s meals without adjustments for illness or holidays, which may introduce bias into the dietary diversity scores reported by enumerators.
Conclusion
Household hunger is a significant public health issue in Mont Ngafula II health zone. This study filled several gaps regarding household hunger, children’s nutritional status. It therefore necessary to implement need for integrated, equity focused interventions, including poverty reduction, social protection, nutrition programmes such as nutrition specific, and nutrition-sensitive, and initiatives to improve diet through urban agriculture and nutrition education.
Acknowledgements
We are grateful to academic authorities from Kinshasa School of Public Health and authorities from Mont Ngafula II health zone where the study has been conducted for facilitating the data collection.
Ethics statement
This study was approved by the ethics committee of the Kinshasa School of Public Health, University of Kinshasa, under approval number ESP/CE/39B/2024 dated November 24, 2024. Informed consent was obtained from all participants involved in this study.
Funding
This research received no external funding
Authorship contributions
Eric Mopasola Onya Emox designed and drafted the primary research protocol. The technical components and scientific research standards were reviewed and revised multiple times until the final version was achieved and approved for submission by Paulin Mutombo Beya. Statistical oversight and critical scientific revisions were provided by Paluku Phillippe, Makaba Richard, Jobalo Yannick, Satny Gbiambi, Mbambula Michel, Batuli Din-ar, Disuemi Emerite, Wabi Tannie, Bosonkie Marc, Botomba Steve and Mutombo Paulin.
Disclosure of interest
The authors completed the ICMJE Disclosure of Interest Form (available upon request from the corresponding author) and disclose no relevant interests.
Correspondence to
Eric mopasola onya Emox Department of Nutrition, Kinshasa School of Public Health, 81/A Q/Diangenda, Ngiringiri Township, Kinshasa Democratic Republic of the Congo ericmopasola@gmail.com