Acute malnutrition in children remains a critical global public health concern, particularly in the Democratic Republic of the Congo (DRC).1–5 In the DRC, malnutrition is responsible for 8.2% of wasting cases and is a contributing factor in approximately 45% of deaths among children under five years old.6,7 These alarming statistics underscore the significant obstacles the nation faces in achieving Sustainable Development Goal 2 (SDG 2) by 2030. Given their specific nutritional needs and rapid growth, young children are highly vulnerable, and inadequate nutrition directly impairs their development.8 To effectively combat this crisis, the capacity for early and accurate diagnosis is essential.9
The primary tools currently used to identify acute malnutrition are the Mid-Upper Arm Circumference (MUAC) and the Weight-for-Height (W/H) index. The World Health Organization (WHO) accepts both, but W/H is generally considered the reference standard for estimating overall population prevalence, especially in emergency settings.2,10–14 Crucially, numerous studies have demonstrated limited concordance between these two indicators, with typically only about 40% of acutely malnourished children meeting both criteria simultaneously.11 This discordance is complex, arising from differences in what each tool measures, W/H reflects acute wasting relative to height, while MUAC reflects soft tissue reserves (muscle and fat), and potential variations in regional anthropometry or physiological response.13 Recognizing that reliance on a single measure risks widespread misclassification, the PRONANUT programme in the DRC utilizes both indicators.
The context of this analysis is vital, as the period studied, 2020 to 2022, coincided with major humanitarian and socioeconomic disruptions, including the COVID-19 pandemic, which likely intensified underlying nutritional vulnerabilities. Understanding the precise agreement, or lack thereof, between MUAC and W/H during this period is critical for validating current screening protocols and ensuring vulnerable children are correctly identified. The aim of this study is therefore to critically assess the level of agreement between W/H and MUAC in estimating the prevalence of acute malnutrition, using comprehensive SMART survey data collected by PRONANUT and its partners in the DRC between 2020 and 2022. The resulting evidence is intended to inform and optimize screening strategies to improve child health outcomes
METHODS
Study design
This analysis constitutes a diagnostic test study based on the rigorous analysis of aggregated, cross-sectional data derived from the Surveillance, Monitoring and Assessment of Relief and Rehabilitation Needs (SMART) surveys. These surveys were conducted by PRONANUT and its partners throughout the DRC between 2020 and 2022. The Weight-for-Height (W/H) Z-score was designated as the gold standard (reference test), given its global acceptance for prevalence estimation, against which the Mid-Upper Arm Circumference (MUAC) was evaluated as the screening test.
Study setting and population
The study encompassed the entire national territory of the DRC (2,344,860 km²), covering both urban and rural settings. The study population comprised children aged 6 to 59 months residing in the surveyed areas during the 2020-2022 period. Data were sourced from all relevant PRONANUT-partnered SMART surveys that included both W/H and MUAC measurements. Children presenting with oedema were excluded from the final analysis, following standard SMART protocol.
Sampling and sample size
The data utilized originated from the existing multi-stage probabilistic sampling designs of the individual SMART surveys, which ensured the representativeness of the anthropometric measurements across diverse geographical and socioeconomic strata of the DRC.
The resulting large sample size (detailed in the Results section) was adequate and provided sufficient statistical power and precision to conduct prevalence estimation and comparative diagnostic performance analysis at both national and sub-national levels.
Data collection and processing
Data were collected through the standardized SMART methodology across the specified period. The process involved extracting raw data files from the central PRONANUT database. Data processing began with exporting the files, followed by stringent coding, cleaning, and validation to ensure data quality and consistency prior to the final statistical analysis.
Data analysis
Statistical analysis was performed primarily using Stata 16 (replacing the inconsistent mention of SPSS/Excel for core analysis) to ensure reproducibility and consistency. Descriptive statistics summarized continuous variables (means/SD or medians/IQR) and categorical variables (proportions/percentages). The Chi-square test was used to test associations between categorical variables.
The diagnostic performance of MUAC relative to the W/H gold standard was assessed by calculating sensitivity, specificity, and predictive values using a 2 times 2 contingency table, complemented by the Receiver Operating Characteristic (ROC) curve. Cohen’s Kappa coefficient was employed to evaluate the level of agreement between MUAC and W/H measurements across relevant sub-groups (age and sex). A Kappa value > 0.81 was interpreted as “almost perfect” agreement. A p-value < 0.05 defined statistical significance.
Ethics consideration
This study received ethical clearance from the Ethical Committee of Kinshasa School of Public Health (Reference: ESP/CE/109B/2024). Given the use of secondary, aggregated data, confidentiality and privacy were ensured through the prior anonymization of sensitive individual information conducted by the data custodians. Transparency was maintained by strictly adhering to the authorized use of data from PRONANUT’s national server.
RESULTS
Sociodemographic characteristics
The analysis included a total of 16,427 children aged 6 to 59 months. The sample distribution was balanced by sex, with 49.7% (n=8,170) being girls and 50.3% (n=8,257) being boys. The majority of children fell into the 24-59 months age group (63.1%, n=10,362), followed by 12-23 months (23.6%, n=3,883), and 6-11 months (13.3%, n=2,182).
Prevalence of acute malnutrition
The estimated national prevalence of global acute malnutrition (GAM) differed significantly depending on the measurement tool used (Table 1).
-
W/H Index: Showed a GAM prevalence of 10.9% (95% CI: 10.3%–11.3%). Of these, 9.2 % were classified as moderate acute malnutrition (MAM) and only 1.6% as severe acute malnutrition (SAM).
-
MUAC: Showed a higher overall GAM prevalence of 12.9% (95% CI: 12.4%–13.4%). Crucially, MUAC identified a significantly higher proportion of SAM cases (3.1%) compared to the W/H index, suggesting a potentially different, and more urgent case identification profile.
Malnutrition prevalence by sub-groups
The analysis of malnutrition across sub-groups revealed distinct patterns based on the indicator (Tables 2 & 3):
-
W/H (Table 2): Showed a statistically significant difference between the sexes (p < 0.001), with boys showing a slight predominance of malnutrition. The 12-23 months age group was clearly the most affected, accounting for the highest proportion of both MAM (30.2%) and SAM (40.0%) cases.
-
MUAC (Table 3): Did not show any significant difference between the sexes (p=0.400), contrasting with the W/H findings. However, MUAC confirmed that the 12-23 months age group remains the most vulnerable, accounting for 29.6% of MAM and 33.9% of SAM cases, highlighting a period of critical nutritional risk regardless of the diagnostic tool.
Prevalence and concordance
The combined analysis revealed a limited overlap in case identification: only 4.4% (n=724) of children had acute malnutrition when both methods were combined (W/H and MUAC). This limited combined prevalence strongly suggests that the two indices are identifying different children, hinting at distinct biological or anthropometric vulnerabilities.
The formal diagnostic test evaluation confirmed this poor agreement (Table 4 & 5):
-
Agreement (Kappa): The Cohen’s Kappa coefficient was extremely low (0.030, p < 0.001), reflecting poor concordance between MUAC and W/H. This epidemiological finding underscores that the two methods are not interchangeable for diagnosing acute malnutrition in the study population.
-
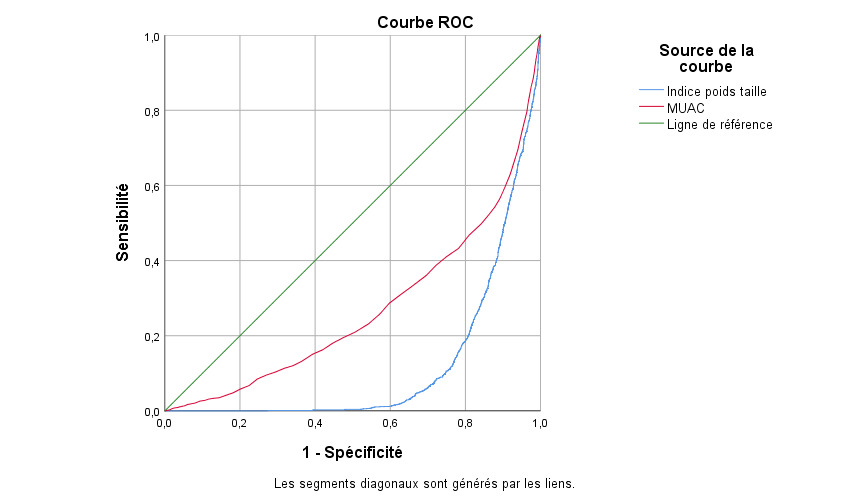
MUAC Performance: Using W/H as the gold standard, MUAC demonstrated low sensitivity (40.6%), meaning it missed a significant proportion of children identified as malnourishment by the W/H index (1,059 false negatives). However, its high specificity (90.4%) indicates that MUAC is reliable in identifying children who are not malnourished (13,245 true negatives). The ROC curve analysis confirmed that while MUAC is simpler for screening, its overall discriminative ability is lower than that of W/H (Figure 1).

DISCUSSION
The analysis confirmed a profound lack of concordance between the Weight-for-Height (W/H) index and Mid-Upper Arm Circumference (MUAC) (Kappa = 0.030), suggesting the two indicators identify fundamentally different subsets of children with Global Acute Malnutrition (GAM). The prevalence estimates themselves varied significantly (W/H: 10.9% vs. MUAC: 12.9%). This discordance is critical because it implies W/H and MUAC capture distinct biological processes: W/H reflects wasting, often linked to rapid changes in food intake, while MUAC reflects body mass reserves, particularly muscle and subcutaneous fat, which may relate more closely to mortality risk, as consistently highlighted by studies globally (15). The limited combined prevalence (4.4%) underscores this minimal overlap, highlighting that relying on a single measure is not merely imprecise but leads to the misclassification of the majority of cases. Furthermore, the observation that only W/H detects a significant sex difference (p=0.001), disadvantaging boys, suggests that anthropometric diversity and biological growth patterns in the DRC may be differentially captured by the two measures, requiring deeper physiological investigation.
MUAC demonstrated high specificity (90.4%) and a strong negative predictive value (92.6%), confirming its utility as an excellent rule-out tool for quickly excluding malnutrition in unaffected children, which aligns with community screening policies. However, the low sensitivity (40.6%) is the most critical finding. This low sensitivity means that MUAC missed 1,059 cases identified by W/H, creating a significant “detection gap.” This shortfall may stem from the tool’s inherent inability to detect early stages of wasting or could reflect measurement errors in the field. The low positive predictive value (PPV: 34.1%) further illustrates the challenge: only one-third of MUAC-positive children are confirmed by W/H, which has implications for program efficiency (false positives).
Comparing these figures to studies in Africa and elsewhere, such as those by Grellety et al. (17), where sensitivity is consistently below 50% when W/H is used as the standard, corroborates that this low sensitivity is a constant operational constraint of MUAC. Similar studies by Laillou et al. (2) and Mwene-Batu et al. (3) have also highlighted this poor concordance and the necessity of not relying on a single measure for diagnosis, demanding a critical reassessment of MUAC’s role as a sole diagnostic criterion.
The finding that the 12-23 months age group is the most affected by malnutrition, regardless of the indicator, strongly emphasizes this period as a critical “window of vulnerability,” coinciding with the transition from exclusive breastfeeding to complementary feeding, which is often inadequate. Contextual comparison with other studies in the region, such as those conducted in Kindu and Kisangani (DRC) and Bamako (Mali), which report slightly higher overall prevalences (up to 14.2%), (11-13)reinforces the link between malnutrition and known risk factors like low birth weight, non-exclusive breastfeeding, and chronic infections. However, simply noting prevalence differences is insufficient; the comparison should focus on whether the patterns of concordance and discordance observed in the DRC mirror those in other settings. The consistent failure of MUAC to perfectly align with W/H across various contexts reinforces the argument that a combined approach is justified, not just because of the tool’s inherent limitations but because it is the only way to capture the multifaceted nature of malnutrition. Research by De Onis et al. (16) emphasizes the complexity of growth patterns and the need for multiple indicators in settings with high biological and environmental diversity like the DRC.
Strengths and limitations
The study’s strengths include a large sample size ($16,427$ children) and the use of high-quality, internationally recognized SMART survey data (2020-2022), ensuring reliable and representative findings. The primary limitation is the low sensitivity of MUAC (40.6%) and the inability of this secondary analysis to explore underlying socio-economic, dietary, or environmental determinants of malnutrition. Consequently, we recommend a combined approach in the DRC’s strategy: MUAC for community triage and W/H for clinical confirmation. Future research must focus on the biological reasons for discordance and developing context-specific MUAC cutoffs to improve case detection (18).
CONCLUSIONS
This study confirms the poor agreement between W/H and MUAC in the DRC, highlighting MUAC’s low sensitivity risks significant case under-detection. PRONANUT should adopt a differentiated strategy: using MUAC for community triage (screening) and retaining W/H for clinical diagnosis and admission. This approach mitigates the risk of missing children while leveraging MUAC’s simplicity. Urgent research is needed to determine context-specific MUAC thresholds or integrate MUAC-for-age to improve high-risk case identification
ACKNOWLEDGEMENTS
The authors are grateful to the National Nutrition Program Committee and the Kinshasa School of Public Health Committee for their valuable support and collaboration
DISCLAIMER
The views expressed in this article are those of the authors and do not necessarily represent the official position of their institutions.
ETHICS STATEMENT
Ethical approval was obtained from the Ethics Committee of the School of Public Health, University of Kinshasa (Approval No. ESP/CE/109B/2024). Written informed consent was obtained from all parents/guardians and healthcare providers involved in the main study.
DATA AVAILABILITY
The datasets generated and/or analyzed during the current study are available from the corresponding author upon reasonable request.
FUNDING
This research received no external funding. The authors declare that no article processing charge (APC) was funded by external sources.
AUTHORSHIP CONTRIBUTIONS
-
Nsima L: Conception of the study, design, and drafting of the manuscript.
-
Nkongolo B-K: Data analysis, interpretation of findings, and critical revision of the manuscript.
-
Nahimana D and Mayavanga J-B: Data collection, statistical analysis, and contextual interpretation.
-
Bosonkie M and Muel TMC: Protocol validation, manuscript editing, and critical revision.
-
All authors meet the ICMJE authorship criteria, approved the final version of the manuscript, and agree to be accountable for all aspects of the work.
DISCLOSURE OF INTEREST
The authors completed the ICMJE Disclosure of Interest Form (available upon request from the corresponding author) and declare no conflicts of interest.