Child malnutrition remains a major public health concern in the Democratic Republic of Congo (DRC), particularly among children from indigenous communities living in remote areas.1 This crisis presents a triple burden: undernutrition, rising overnutrition, and dietary imbalances in poor households.2 Globally, 149.2 million children under five are stunted, 45.4 million are wasted, and 38.9 million are overweight. In Africa, progress in reducing stunting remains slow, and the DRC is among the ten countries contributing to 60% of the global burden of wasting. National data show a decline in wasting from 16% in 2001 to 6.5% in 2018.3–5
The 2023 national nutrition survey reported an acute malnutrition rate of 8.2%, including 2.6% classified as severe, surpassing the World Health Organization’s emergency threshold.4 Chronic malnutrition affects 47.9% of children, and underweight prevalence stands at 26.7%, with 9.6% in severe form.5 Between August 2022 and March 2023, the average underweight rate was 7.5%, peaking at 8.7% in March.3,4 The 2014 Demographic and Health Survey, 2018 Multiple Indicator Cluster Survey, and 2023 National Nutrition Survey confirm stagnation in stunting (43%) and underweight (24%), with moderate improvement in wasting (from 9% to 6.5%).5–7
In Tshopo province, key drivers include poor dietary diversity, poverty, food insecurity, and limited access to health and education services.3,7–9 The Integrated Management of Acute Malnutrition program is available in only 38% of health facilities. In Yangambi, despite agricultural activity, food shortages and insecurity persist.5,6
Nutritional indicators in Tshopo are worsening: wasting rose from 4.3% in 2018 to 7% in 2023, with higher prevalence among children aged 6–23 months (9.8%) than those aged 24–59 months (7.4%). Chronic malnutrition affects 47.2%, and underweight 26.8%.6 In Bafwasende’s Pygmy communities, social exclusion, poverty, geographic isolation, and limited access to services exacerbate vulnerability. The lack of reliable data and logistical constraints hinder effective interventions. This study aims to identify the specific drivers of malnutrition among Pygmy children under five in Bafwasende to inform targeted, evidence-based policies.
II. METHODOLOGY
TYPE OF STUDY
This will be an analytical cross-sectional study conducted among Pygmy children under five in the Bafwasende territory during the month of May of the year 2025.
STUDY SITE

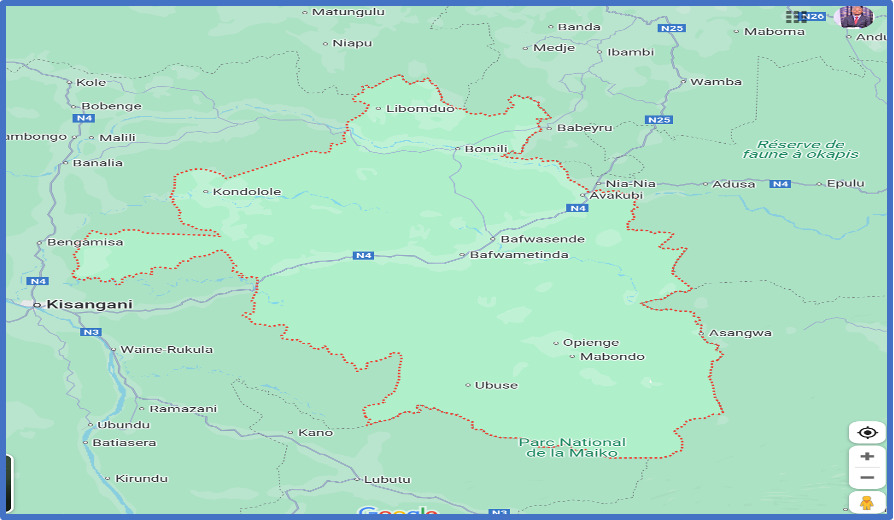
Located in the eastern DRC’s Tshopo province, Bafwasende is the largest territory in the country, covering 48,482 km² and home to a population of 413,545. Boasting remarkable biodiversity and abundant mineral resources, it is home to several ethnic groups, including the Mbuti Pygmies. Its economy is based primarily on small-scale agriculture, fishing, and livestock rearing. The territory includes three health zones and 50 health facilities, but only the Bafwasende health facility is truly accessible. The most common illnesses include malaria, respiratory infections, diarrheal diseases, tuberculosis, and HIV/AIDS.
STUDY POPULATION AND STATISTICAL UNIT
This study targeted mothers and primary caregivers of Pygmy children under five in the Bafwasende health zone, selected for its accessibility and high concentration of indigenous communities. It focused exclusively on Pygmy households to explore their unique nutritional challenges. Two units were defined: children for anthropometric assessments, and caregivers for socioeconomic and dietary data. Eligibility required Pygmy identity, residence in selected villages, and presence during data collection. Only biological mothers or primary caregivers who consented were included; those who declined participation were excluded.
SAMPLING
1. SIZE
To estimate the required sample size, we used the standard formula for prevalence studies
n ≥ or n ≥
Where:
-
Z=1.96Z = 1.96 corresponds to a 95% confidence level
-
p=0.472p = 0.472, the estimated prevalence of stunting from the ENN DRC 2023 report for Tshopo Province
-
q=1−p=0.528q = 1 - p = 0.528
-
d=0.05d = 0.05, the desired precision
Substituting these values, we obtained : = 382 children
To account for potential non-response and refusals, the sample size was increased by 19%, resulting in a final target of 455 children under five years of age.
SAMPLING TECHNIQUE
To ensure a representative and unbiased sample of Pygmy households with children under five, the study employed a four-stage multistage sampling method, designed to reflect the demographic structure of the Bafwasende health zone.
-
Stage 1: Territorial Selection The Bafwasende health zone was purposively selected due to its logistical accessibility and significant concentration of Pygmy populations.
-
Stage 2: Health Area Selection Out of eight health areas, three were randomly selected using simple random sampling to reduce geographic bias.
-
Stage 3: Village Selection Within each selected health area, three Pygmy villages were randomly chosen to capture intra-area variation.
-
Stage 4: Household Identification and Distribution
A household listing was conducted in each village. Households with at least one child under five were enrolled. The final sample of 455 households was distributed proportionally across the three health areas:
This proportional allocation preserved demographic balance and enhanced generalizability. The sampling design was accounted for during analysis using appropriate weights and clustering adjustments.
LIST OF VARIABLES
The study gathered a comprehensive set of variables to assess child malnutrition among Pygmy communities. Data collection focused on the following components:
-
Sociodemographic characteristics: Included age, marital status, education level, and occupation of mothers or caregivers, as well as the age and sex of each child.
-
Nutritional indicators: Assessed using WHO standards and included stunting, wasting, underweight, edema, weight, height, and mid-upper arm circumference (MUAC).
-
Anthropometric measurements:
-
Weight was measured using calibrated SECA 874 electronic scales (±100 g precision).
-
Height was measured using UNICEF height boards: recumbent for children <87 cm and standing for those ≥87 cm.
-
MUAC was measured using UNICEF color-coded tapes.
All measurements were taken twice. If discrepancies exceeded 0.2 kg (weight) or 0.5 cm (height/MUAC), a third measurement was taken, and the average of the two closest values was recorded.
Inter-observer reliability was monitored weekly using standardized checklists and paired measurements.
-
-
Dietary practices and food access: Evaluated using two standardized tools:
-
Food Consumption Score (FCS): Based on the frequency and nutritional weight of eight food groups consumed over the past seven days. Scores were categorized as poor (<21), borderline (21.5–35), or acceptable (>35).
-
Household Dietary Diversity Score (HDDS): Measured the number of food groups (out of 12) consumed in the past 24 hours, serving as a proxy for household food security.
This structured approach ensured data quality and consistency across all surveyed households.
DATA COLLECTION
a. Collection Techniques
Data were gathered through face-to-face interviews using a structured questionnaire digitally administered via KoboCollect, enabling real-time validation and secure data storage. Anthropometric measurements followed standardized WHO protocols and included:
-
Weight: Measured with SECA 874 electronic scales (±0.1 kg precision).
-
Height: Assessed using UNICEF height boards (recumbent for children <87 cm, standing for ≥87 cm).
-
MUAC: Measured with UNICEF color-coded tapes.
Measurements were taken twice; if discrepancies exceeded 0.2 kg (weight) or 0.5 cm (height/MUAC), a third measurement was taken, and the average of the two closest values was recorded.
Weekly inter-observer reliability checks were conducted using standardized checklists. To minimize recall bias in dietary data, enumerators used visual aids, portion size references, and probing techniques to improve the accuracy of the Food Consumption Score (FCS) and Household Dietary Diversity Score (HDDS).
b. Data Collection Process
The study received ethical approval from the Ethics Committee of the Kinshasa School of Public Health (approval number: ESP/CE/58/2025).
Data collectors, comprising nurses and community health workers, underwent two days of training covering anthropometry, ethical conduct, KoboCollect usage, and interview techniques.
A pre-test conducted in a neighboring village helped validate the tools, which were developed in French and orally translated into Lingala or Swahili, with back-translation to ensure accuracy. Over a four-week period, six teams surveyed approximately 76 households each.
These variables were essential for understanding the multifactorial determinants of child malnutrition in Pygmy communities.
DATA PROCESSING AND ANALYSIS
Data were managed using KoboCollect and analyzed with SPSS version 26. The following steps were undertaken:
-
Descriptive statistics: Included means, medians, standard deviations, and frequency distributions. Normality of continuous variables was assessed using the Kolmogorov test.
-
Nutritional status assessment: Conducted using WHO Anthro software, which generated Z-scores for:
-
Underweight (weight-for-age)
-
Stunting (height-for-age)
-
Wasting (weight-for-height)
-
Thresholds used were Z ≤ -2 for global malnutrition and Z < -3 for severe cases.
-
Dietary indicators: – Food Consumption Score (FCS): Based on frequency and nutritional weight of eight food groups over the past week.
-
Household Dietary Diversity Score (HDDS): Counted the number of food groups consumed in the past 24 hours (out of 12), used as a proxy for food security.
-
Regression analysis:
-
Bivariate analysis was performed to identify associations.
-
Variables with p < 0.05 were retained for multivariate logistic regression.
-
Independent variables included health area, maternal demographics, household size, child characteristics, food expenditure, FCS, and HDDS.
-
Each malnutrition type, acute, chronic, and underweight, was analyzed separately.
-
Handling of missing data: Managed using listwise deletion to maintain consistency across models.
-
Model fit and reporting: Assessed using the Hosmer-Lemeshow test. Results were presented with odds ratios (ORs), 95% confidence intervals (CIs), and p-values to determine statistical significance
-
ETHICAL CONSIDERATIONS
The study followed international and national ethical standards, with approval from the Kinshasa School of Public Health (ESP/CE/58/2025) and permissions from local authorities. Informed consent was obtained from all participants, and confidentiality was ensured through data anonymization and restricted access. Children showing signs of malnutrition were referred to nearby health facilities for care. All relevant respondent categories, mothers, caregivers, and heads of household, were included to generate evidence aimed at improving the nutritional status of Pygmy children in Bafwasende.
III. RESULTS
Sociodemographic Characteristics of Mothers and Guardians of Children Under Five Years of Age
Among the 455 respondents, approximately four out of ten reside in Bafwanduo, and six out of ten are aged between 20 and 34 years. More than half have no formal education, and only two respondents have attained higher education. Nearly seven out of ten are married or in a union. Furthermore, six out of ten are unemployed, more than half of households have fewer than five members, and half spend between 5,000 and 10,000 CDF per day on food—indicating significant economic constraints (Table I).
Prevalence of Different Forms of Malnutrition in Children Under Five Years of Age in Bafwasende Health Zone
Among ten children under five, nearly three suffer from global acute malnutrition, and one in five presents a severe form, with prevalence estimates ranging from 24.3% to 32.5%. Chronic malnutrition (stunting) is more widespread, affecting nearly seven out of ten children, with half suffering from the severe form. Regarding underweight, nearly half of children are affected, evenly split between moderate and severe forms (Table II).
Dietary Habits of Households with Children Under Five and Nutritional Practices Specific to Pygmy Communities
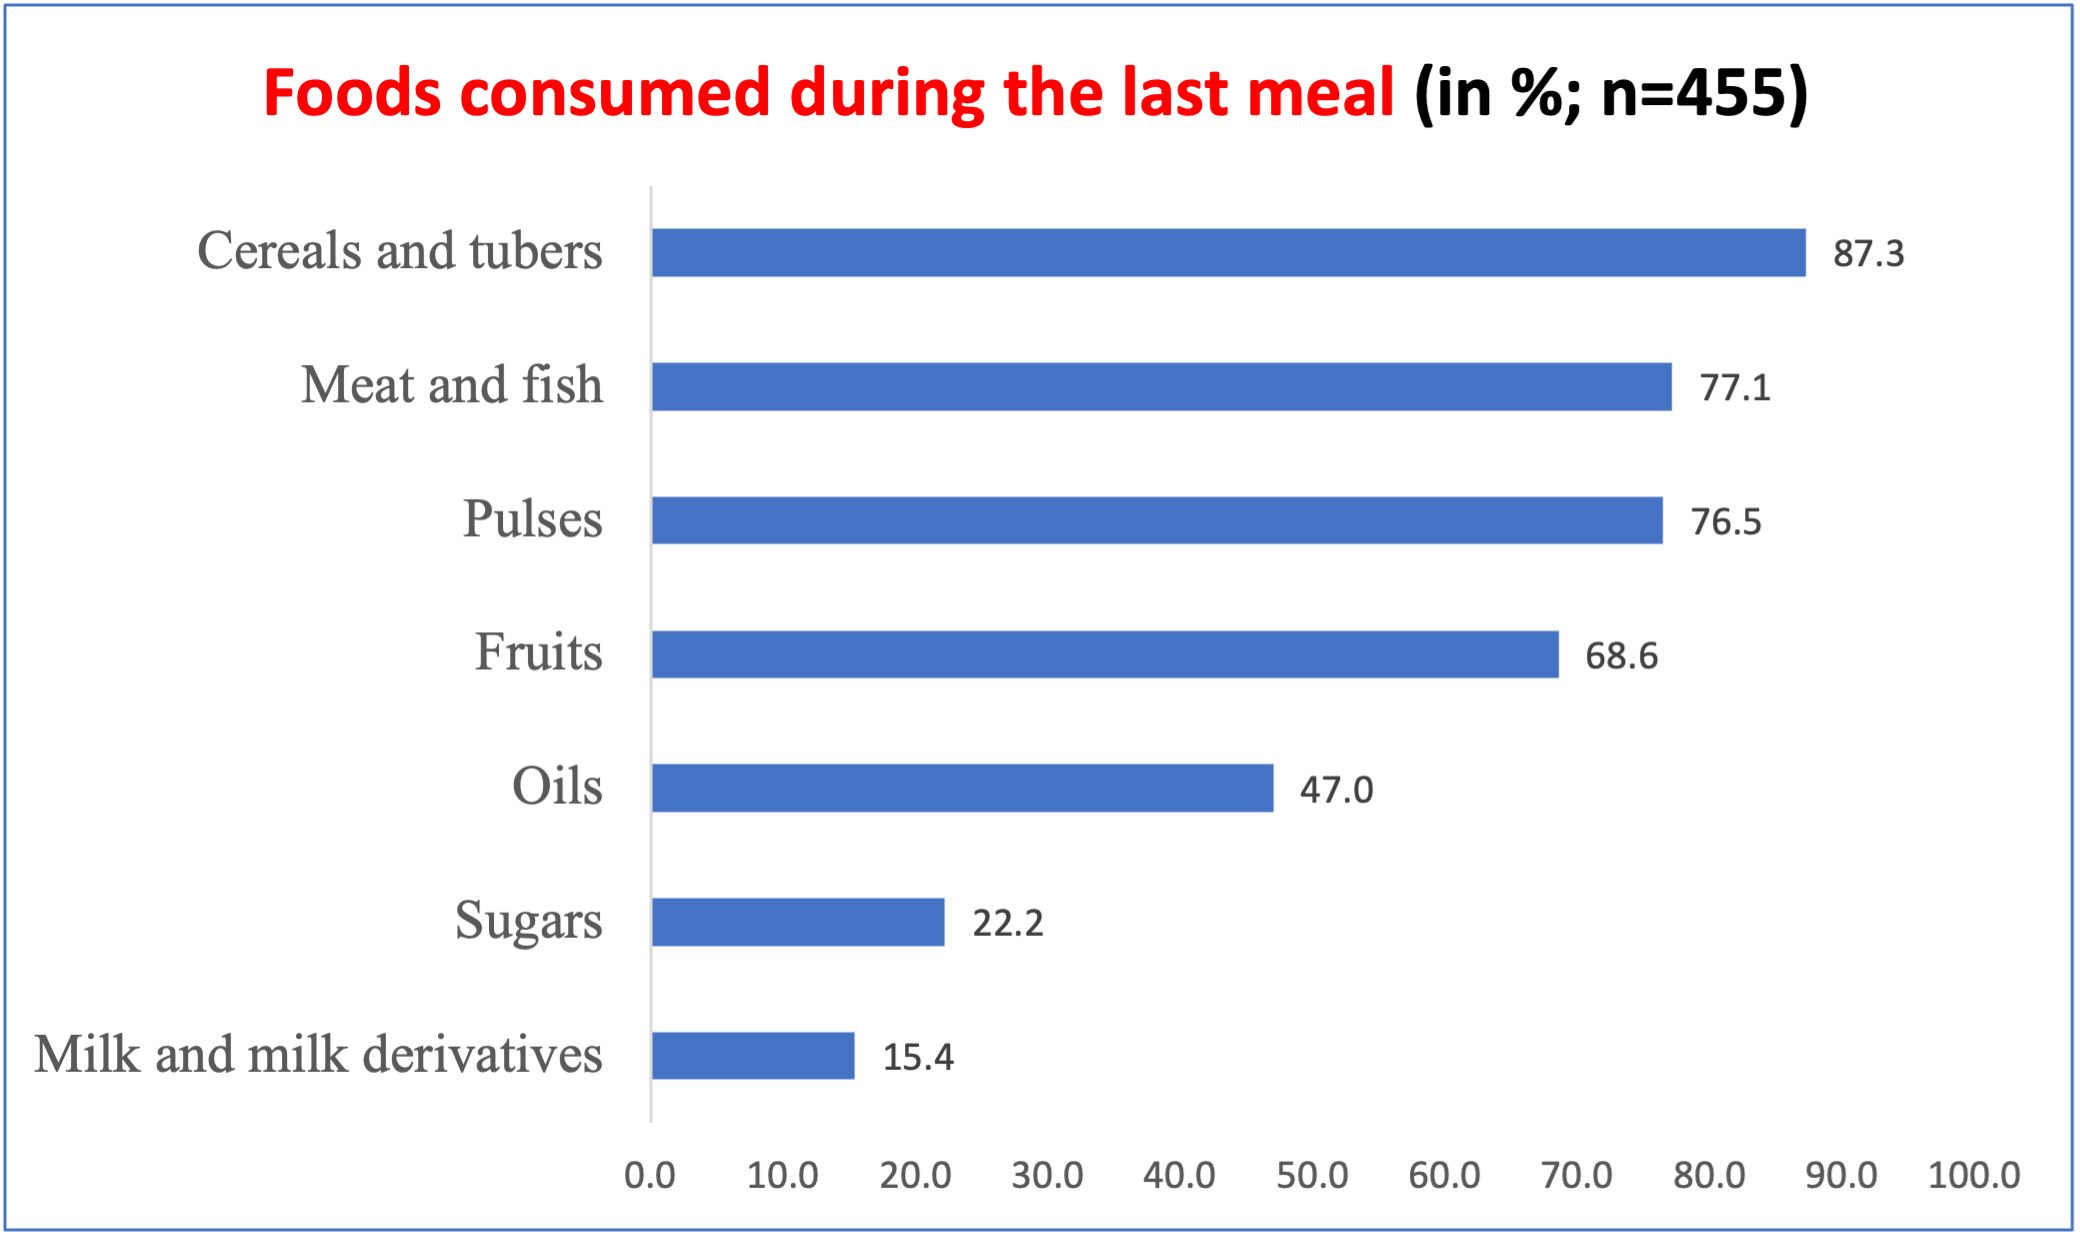
The most consumed foods during the last meal were cereals and tubers (87.3%), followed by meat/fish (77.1%) and legumes (76.5%), indicating a diet rich in carbohydrates and protein. However, low consumption of milk and dairy products (15.4%) suggests potential calcium deficiencies (Figure 2).

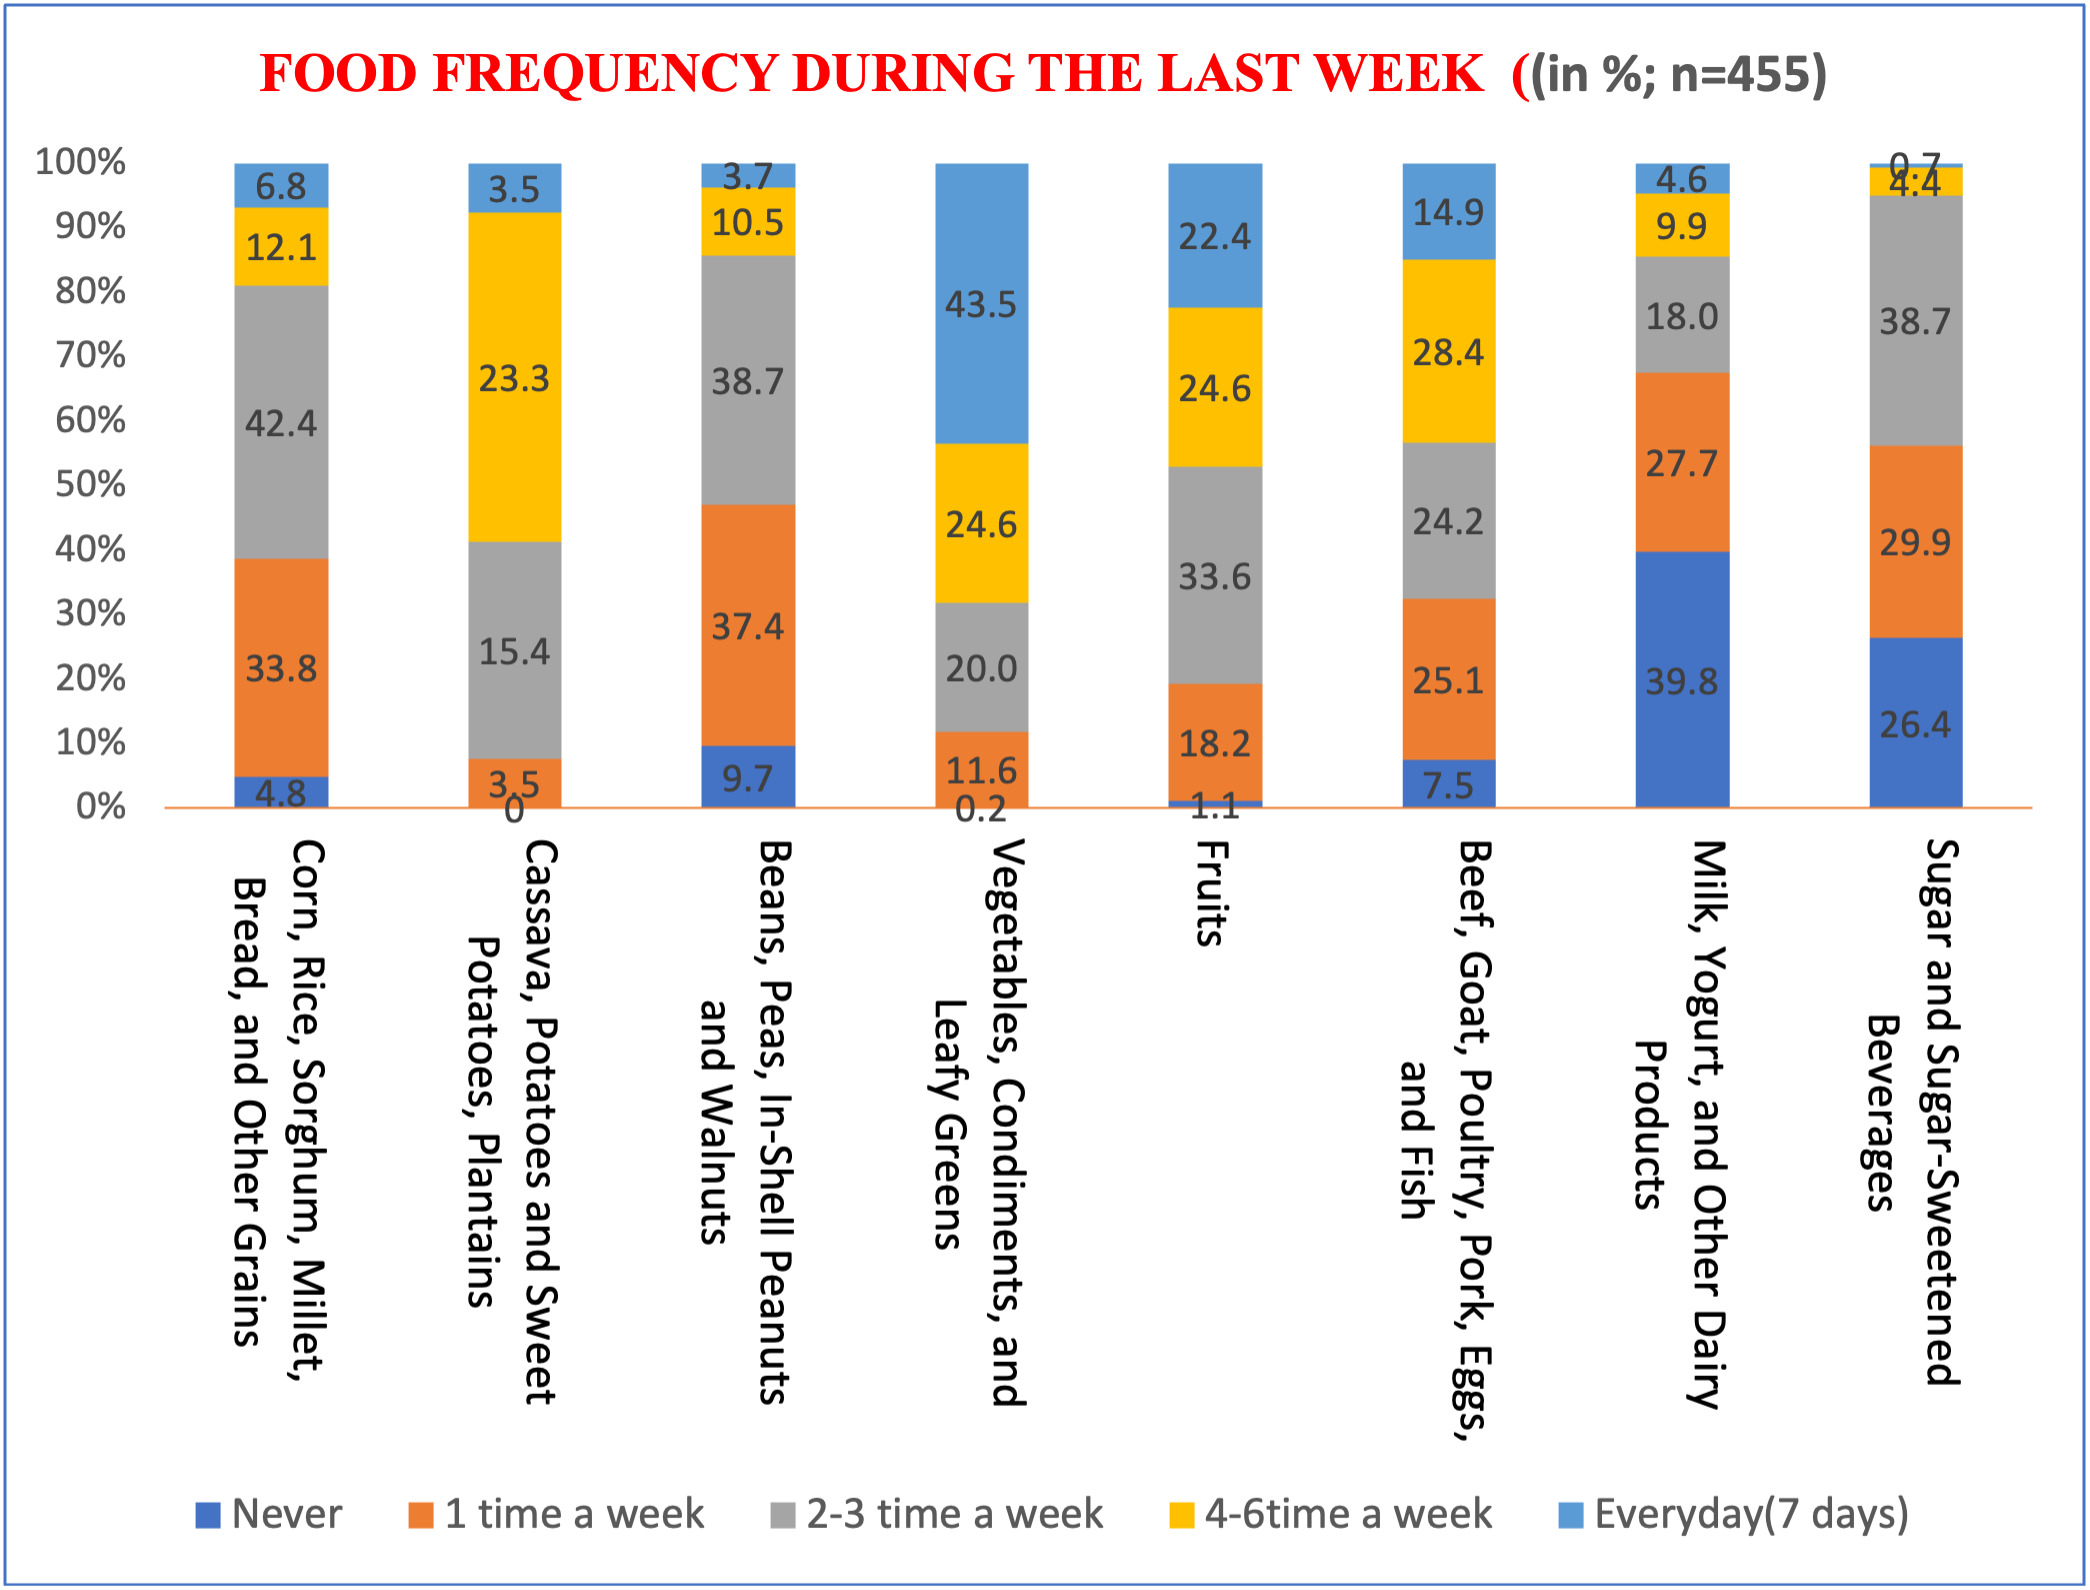
Daily consumption patterns show that vegetables and leafy greens are the most frequently consumed (43.5%), followed by fruits (22.4%). Animal products are consumed daily by only 14.9%, and cereals by 6.8%. Dairy products are the least consumed daily (4.6%), and sugary items are rarely consumed. Notably, nearly four out of ten women report never consuming milk or dairy products, posing nutritional risks for children (Figure 3).

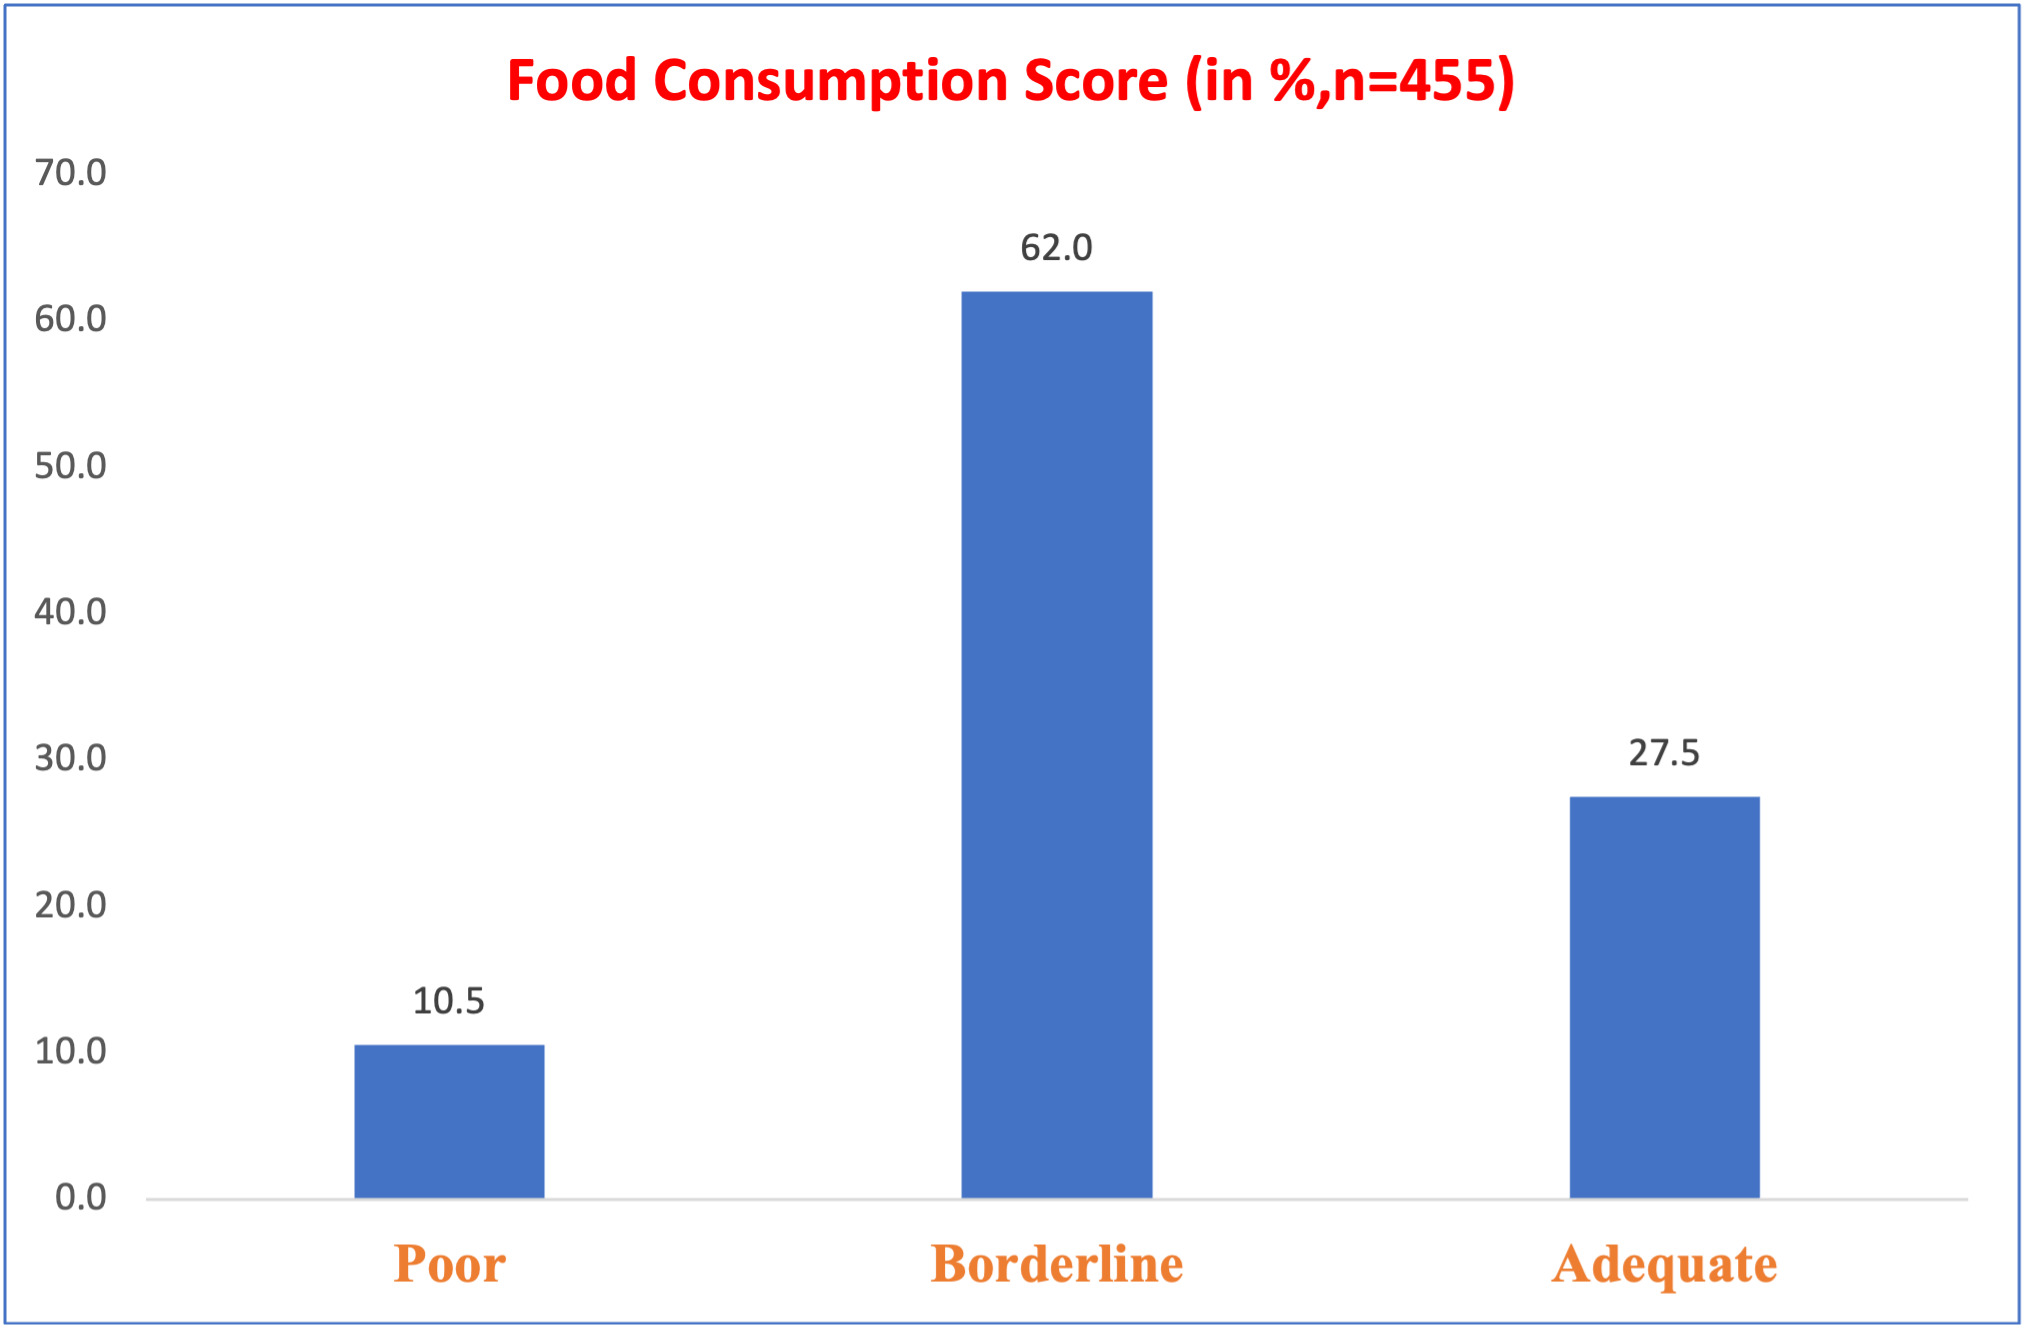
The food consumption score of Pygmy households reveals significant disparities in dietary quality: 62% have a limited diet, and 10.5% have a diet considered poor for children (Figure 4).

Factors Associated with Acute Malnutrition, Chronic Malnutrition, and Underweight in Pygmy Children Under Five Years of Age
Acute malnutrition is significantly associated with limited food consumption, daily food expenditures below 5,000 CDF, child age (6–11 months), low maternal education, and marital instability, particularly among divorced or separated mothers. These factors reflect food and social insecurity that directly affect nutritional status.
Chronic malnutrition is more prevalent among children born to very young mothers (15–19 years) and those aged 6–11 months. Households with low food consumption scores or daily expenditures between 5,000 and 10,000 CDF are also at increased risk.
Underweight is linked to young maternal age, lack of formal education, unstable marital status, and maternal unemployment. Children aged 6–11 months from households with low income and poor dietary diversity are the most vulnerable. These findings underscore the need for targeted interventions that integrate economic, educational, and social support to improve child nutrition (Table III).
IV. DISCUSSION
KEY FINDINGS
This study, conducted in 2025 in the Bafwasende Health Zone, aimed to identify factors associated with malnutrition in Pygmy children under five years of age. Conducted in 2025 in the Bafwasende Health Zone, this study on 455 Pygmy children under five years of age reveals a critical nutritional situation: 30% suffer from acute malnutrition, 68% from chronic malnutrition and 50% from underweight. The main associated factors are: low food consumption score, daily expenditure <5,000 CDF, child age (6–11 months), young mothers not in school, unemployed or separated. The local diet, rich in carbohydrates and proteins, remains low in dairy products and fruits, accentuating deficiencies in calcium and essential micronutrients.
NUTRITIONAL STATUS OF PYGMY CHILDREN IN BAFWASENDE: A DEEPENING CRISIS
In 2025, a field study conducted in the Bafwasende Health Zone revealed a deeply concerning nutritional profile among Pygmy children under five years of age. The prevalence of Global Acute Malnutrition ranged from 24.3% to 32.5%, with nearly 20% of children affected by its severe form. Chronic Malnutrition was observed in 69% of children, while Underweight Prevalence reached 47.3%. The most vulnerable age group was 6–11 months, a critical window for growth and development, followed closely by children aged 24–59 months, particularly in the health areas of Bafwanduo and Bafwazana. These figures reflect not only nutritional deprivation but also the broader socio-economic marginalization of Pygmy communities, whose isolation and limited access to services compound their vulnerability.10,11
When compared to national and regional benchmarks, the situation in Bafwasende appears significantly more dire. The Demographic and Health Survey [DHS, 2024] and ENN [2023] report markedly lower national rates: Global Acute Malnutrition at 7–8.2%, Chronic Malnutrition at 45–47.9%, and Underweight Prevalence at 25–26.7%.5–7 In the neighboring territory of Befale, Nkongolo [2023] recorded 2.5% Severe Acute Malnutrition, 11.3% Global Acute Malnutrition, 45% Chronic Malnutrition, and 24.7% Underweight Prevalence.12 Regionally, UNICEF and WFP [2021] estimated that 6.9 million children suffer from Global Acute Malnutrition, including 1.4 million with Severe Acute Malnutrition,13 while FAO [2022] reported that 27% of children live in conditions of severe food poverty.14,15 These disparities underscore the urgent need for targeted interventions in Bafwasende, where structural barriers continue to undermine child health
DIETARY PATTERNS AND FOOD ACCESS IN PYGMY HOUSEHOLDS
The dietary habits of Pygmy households in Bafwasende reflect a reliance on staple foods with limited diversity. Cereals and tubers dominate the diet, consumed by 87.3% of households, followed by meat/fish (77.1%) and legumes (76.5%), forming the primary sources of energy and protein. However, dairy product consumption remains critically low—only 15.4% of households reported dairy intake at the last meal, and 39.8% do not consume it regularly, increasing the risk of calcium deficiency. Vegetables are consumed daily by 43.5% of households, while fruit intake lags at just 22.4%. Animal products appear in only 14.9% of daily meals, and although cereals are frequently present, only 6.8% of households consume them daily.
The Food Consumption Score (FCS) revealed that 62% of households have a limited diet, and 10.5% a poor diet, indicating widespread food insecurity. These patterns are shaped by the traditional subsistence lifestyle of the Pygmy population, centered on hunting, gathering, and small-scale agriculture, constrained by geographic isolation and poor market access. Bermudez and Tucker [2021] observed similar trends in other rural Congolese communities, where tubers dominate and dairy intake is minimal.16 National surveys and reports from UNICEF, WFP, and the National Nutrition Survey confirm that dietary diversity remains low in rural areas, exacerbating malnutrition risks among indigenous children5,13
DETERMINANTS OF MALNUTRITION: SOCIOECONOMIC AND NUTRITIONAL DRIVERS
Multivariate regression analysis revealed that malnutrition among Pygmy children in the Bafwasende Health Zone is strongly influenced by both dietary and socioeconomic factors. Children living in households with a poor or limited Food Consumption Score were significantly more likely to suffer from global acute malnutrition, chronic malnutrition, and underweight. These associations reflect the impact of inadequate dietary diversity and low nutrient intake on child health, consistent with findings from the National Nutrition Survey and UNICEF reports highlighting food insecurity as a major driver of malnutrition in rural Congolese communities.5,13,14
Economic vulnerability further exacerbates nutritional risks. Households with daily food expenditures below 5,000 Congolese francs showed a marked increase in the likelihood of acute malnutrition, underscoring the role of poverty in limiting access to sufficient and nutritious food. Children aged 6 to 11 months were particularly affected, a period known for increased nutritional demands and vulnerability due to the transition from exclusive breastfeeding to complementary feeding. This age-related risk pattern aligns with national data from the DHS [2024], which identifies early infancy as a critical window for intervention.6,7,12
Maternal factors also played a significant role. Children of young mothers aged 15 to 19 years, especially those without formal education or employment, were more likely to experience malnutrition. These findings highlight the influence of maternal socio-economic instability on child health outcomes and echo broader evidence from Black et al. [2020], who emphasize the intersection of poverty, low maternal education, and limited access to healthcare as key determinants of child malnutrition.17 Across Africa, UNICEF and WFP have consistently reported that indigenous populations face the highest rates of malnutrition, reinforcing the urgency of culturally adapted and targeted interventions in regions like Bafwasende.18–21
STRENGTHS AND LIMITATIONS OF THE STUDY
This study’s strengths include its focus on a marginalized population, Pygmy children under five, and use of recent field data with rigorous multivariate analysis to identify malnutrition factors. Findings were contextualized with national benchmarks to inform targeted interventions. However, its cross-sectional design limits causal inference, and potential biases such as recall and social desirability may affect results. Despite using visual aids and probing techniques, misreporting may persist. Seasonal and cultural dietary variations were not assessed. These limitations underscore the need for longitudinal, culturally sensitive research to better address malnutrition in indigenous communities.
CONCLUSION
The study highlights alarming malnutrition among Pygmy children in Bafwasende, linked to socioeconomic factors such as low food consumption, young age, and maternal education. It underscores the urgent need for targeted interventions, incorporating local cultural realities, to improve nutrition and health. Promoting good dietary practices, nutrition education, and access to resources are essential. Finally, regular monitoring and additional research will help adapt strategies to the evolving needs of these marginalized communities.
ACKNOWLEDGMENTS
We are grateful to the local health authorities of Bafwasende and the medical teams who facilitated data collection in the field.
DISCLAIMER
The authors declare no disclaimers. All views expressed are solely those of the authors.
ETHICS STATEMENT
This study was approved by the Ethics Committee of the Kinshasa School of Public Health (approval code: ESP/CE/58/2025). Informed consent was obtained from all participants prior to data collection. All procedures adhered to ethical standards and respected participant confidentiality and dignity.
DATA AVAILABILITY
The data supporting the findings of this study are available from the corresponding author upon reasonable request.
FUNDING
This research received no external funding. The article publication charge (APC) was not funded by any organization.
AUTHORSHIP CONTRIBUTIONS
-
Mangaza Nono conceived the study and contributed to its design, data collection, and manuscript drafting.
-
Nkongolo Bernard-Kennedy supported data collection, analysis, and drafting.
-
Muyer Muel Telo Marie-claire provided statistical oversight, critical revisions, and final approval.
All authors meet ICMJE criteria and approved the final manuscript.
DISCLOSURE OF INTEREST
The authors completed the ICMJE Disclosure of Interest Form (available upon request from the corresponding author) and disclose no relevant interests
Corresponding author:
Nkongolo Bernard-Kennedy, knkongolo28@gmail.com, Telephone : +243810953918