
Food security, as defined by the Food and Agriculture Organization (FAO), exists when all people, at all times, have physical, economic, and social access to sufficient, safe, and nutritious food to meet their dietary needs for an active and healthy life.1 In post-conflict settings, this stability is often undermined by displacement, destruction of livelihoods, and weakened institutional systems. Africa remains one of the most affected regions, with over 342 million people facing severe food insecurity.2,3 In the Democratic Republic of Congo (DRC), despite rich agricultural resources, 26.4 million people were food insecure in 2023, and over 40% of the population was classified in IPC Phase 3 or 4.4–6
The Kasai region, and specifically Kasai Central province, exemplifies these vulnerabilities.7,8 The 2016 Kamuina Nsapu conflict sparked by the assassination of local chief Jean-Pierre Mpandi , led to widespread displacement, collapse of rural production systems, and destruction of basic infrastructure.9–11 Households have resorted to negative coping mechanisms such as reducing meal frequency and selling essential assets. Mothers, caregivers, and children under five are particularly at risk of malnutrition, compounded by challenges like COVID-19, torrential rains, and isolation from public services. Despite intermittent humanitarian assistance, food security remains precarious.12
The Kalomba Health Zone (HZ) was selected for this study due to its high concentration of displaced households, degraded service delivery, and chronic poverty. Previous alerts from the National Nutrition Program (2018)13 and assessments in Miabi14 emphasized worsening livelihoods and rising dependence on aid. By assessing household food security in Kalomba and identifying its key determinants, this study aims to generate evidence to guide effective, context-specific interventions in rural post-conflict environments.
METHODS
The study targeted households with mothers or primary caregivers of children aged 6 to 59 months who had resided in Kalomba for at least six months. Participants were included if they provided informed consent. Households outside the zone, with children not meeting the age criteria, or those declining participation were excluded. This population was chosen to reflect the nutritional realities of vulnerable households and ensure relevance to post-conflict food security dynamics.
Study design and setting
A descriptive, cross-sectional study using a quantitative approach was conducted in the Kalomba Health Zone, located in Tshitadi territory. This area experiences chronic food insecurity, exacerbated by customary conflicts, disrupted agricultural production, poor infrastructure, and high vulnerability among displaced households. Local diets are heavily reliant on staple foods such as fufu and leafy vegetables, with limited diversity and restricted access to animal protein.
Sampling
A three-stage probability sampling design was used to ensure representativeness:
-
Sample size was calculated using the formula :
n ≥ (Z² × p × q) / d², with Z = 1.96 (95% confidence), p = 0.5 (assumed prevalence), and d = 0.05. This produced a minimum sample size of 384 households, increased by 10% for non-response to reach a target of 422 households.
-
Sampling technique involved randomly selecting six of the 17 Health Areas (~30%), then two villages per area. Household listings were established by census, and 70 households were randomly selected per Health Area, with a slight increase in Kalendende to complete the sample.
Data collection
Data were collected using a structured questionnaire administered through KoboCollect on mobile devices. Interviews were conducted face-to-face by trained enumerators over a ten-day period, with seven households interviewed per day per enumerator. The questionnaire included modules on:
-
Household food access, measured using the Household Food Insecurity Access Scale (HFIAS), which captures behavioral and experiential indicators over the previous 30 days.
-
Food Consumption Score (SCA): assessed through a consumption score based on eight food groups, following FAO methodology.
-
Sociodemographic profile of the respondent (age, education, marital status, main occupation, and daily food expenditure).15
Variable definitions and triangulation
Food insecurity levels were classified according to HFIAS into four categories: food secure, mildly insecure, moderately insecure, and severely insecure, avoiding terms like “very severe” to maintain consistency with FAO standards . Dietary diversity was measured via the Food Consumption Score (SCA)15,16:
-
Poor consumption: score < 21
-
Borderline consumption: score between 21.5 and 35
-
Adequate consumption: score > 35
The combination of HFIAS and dietary diversity allowed for triangulation between perceived access constraints and actual consumption behavior, offering a multidimensional view of food security status.
Data analysis
Data were cleaned and analyzed using SPSS Version 25.0. Analyses included:
-
Descriptive statistics: frequencies, proportions, means, and standard deviations
-
Bivariate analysis:
- Chi-square test or Fisher’s exact test (for categorical variables)
-
Significance threshold: p-value < 0.05 Tables and figures were used to present key results, aligned with study objectives and the research question.
Ethical considerations
The study protocol was approved by the Ethics Committee of the Kinshasa School of Public Health (Ref. ESP/CE/74/2024). Written informed consent was obtained from all participants. Confidentiality, dignity, and voluntary participation were upheld throughout the study. Data were anonymized and securely stored.
RESULTS
The following results provide a detailed overview of household conditions in the Kalomba health zone, focusing on sociodemographic characteristics, dietary habits, and food security. The findings expose significant social vulnerabilities and nutritional disparities among mothers and children. They also underscore the urgent need for targeted public health interventions to address widespread food insecurity. The tables and figures are presented in the annexes.
Sociodemographic characteristics of mothers of children aged 6-59 months in the Kalomba health zone
The analysis highlights that more than half of the mothers of children aged 6 to 59 months were under 28 years old and that around 60 % had not achieved a formal level of education . Nine out of ten were living in a union, reflecting a high prevalence of conjugal relationships. Agriculture remains the dominant activity, involving six out of ten mothers. Furthermore, the majority of households spent less than 5 000 FC per day on food , revealing a precariousness marked economic situation . These elements reflect the social and structural vulnerabilities of the Kalomba health zone (Table I).
Eating habits in Kalomba households
Dietary habits are presented in terms of food frequency over the past seven days and food consumption
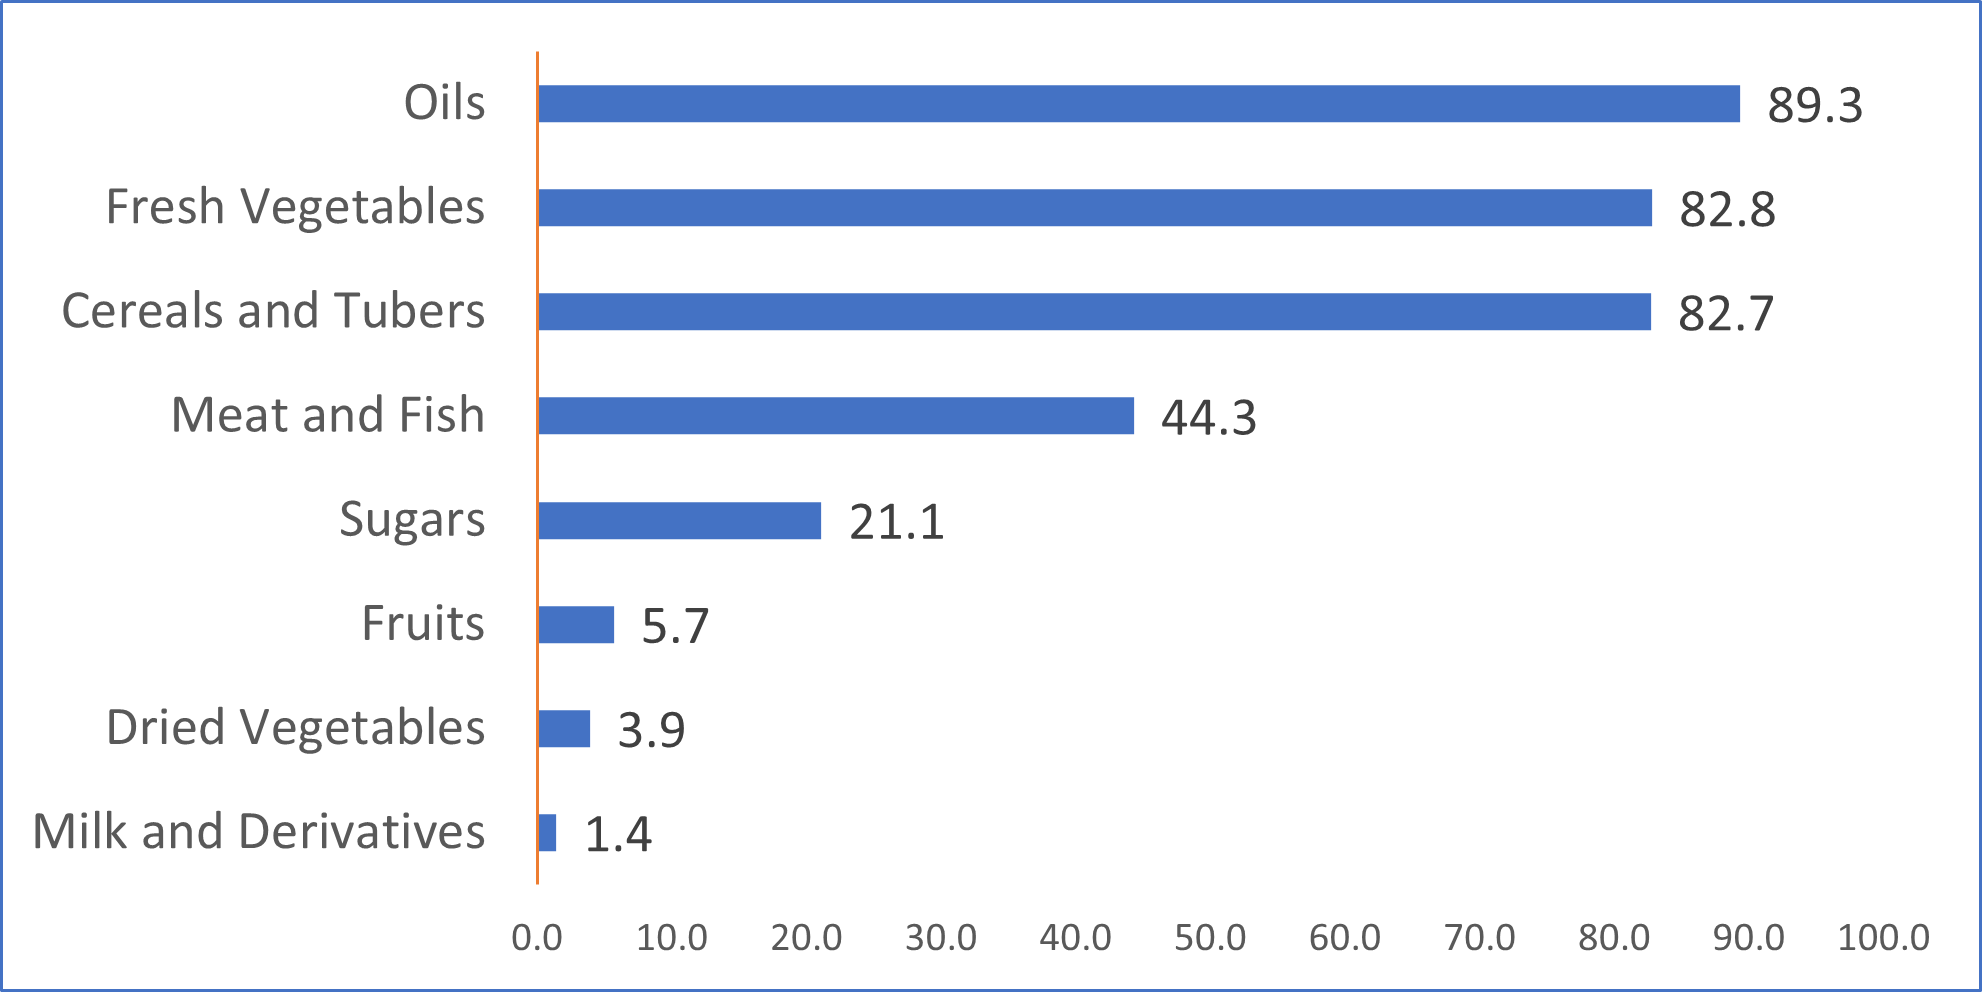
Food frequency reveals a high dependence on cereals and tubers (82.7%) as well as fresh vegetables (82.8%). In contrast, the consumption of pulses (3.9%), fruits (5.7%), and dairy products (1.4%) is extremely low, which can lead to nutritional deficiencies. Meat and fish consumption is moderate (44.3%), while oils are very present (89.3%) and sugars are consumed by 21.1% of households.
The household food consumption score in the Kalomba Health Zone reveals significant disparities in the quality of diets. It shows that 41.9% have a limited diet and 8.5% have a poor diet .
Food security of Kalomba households
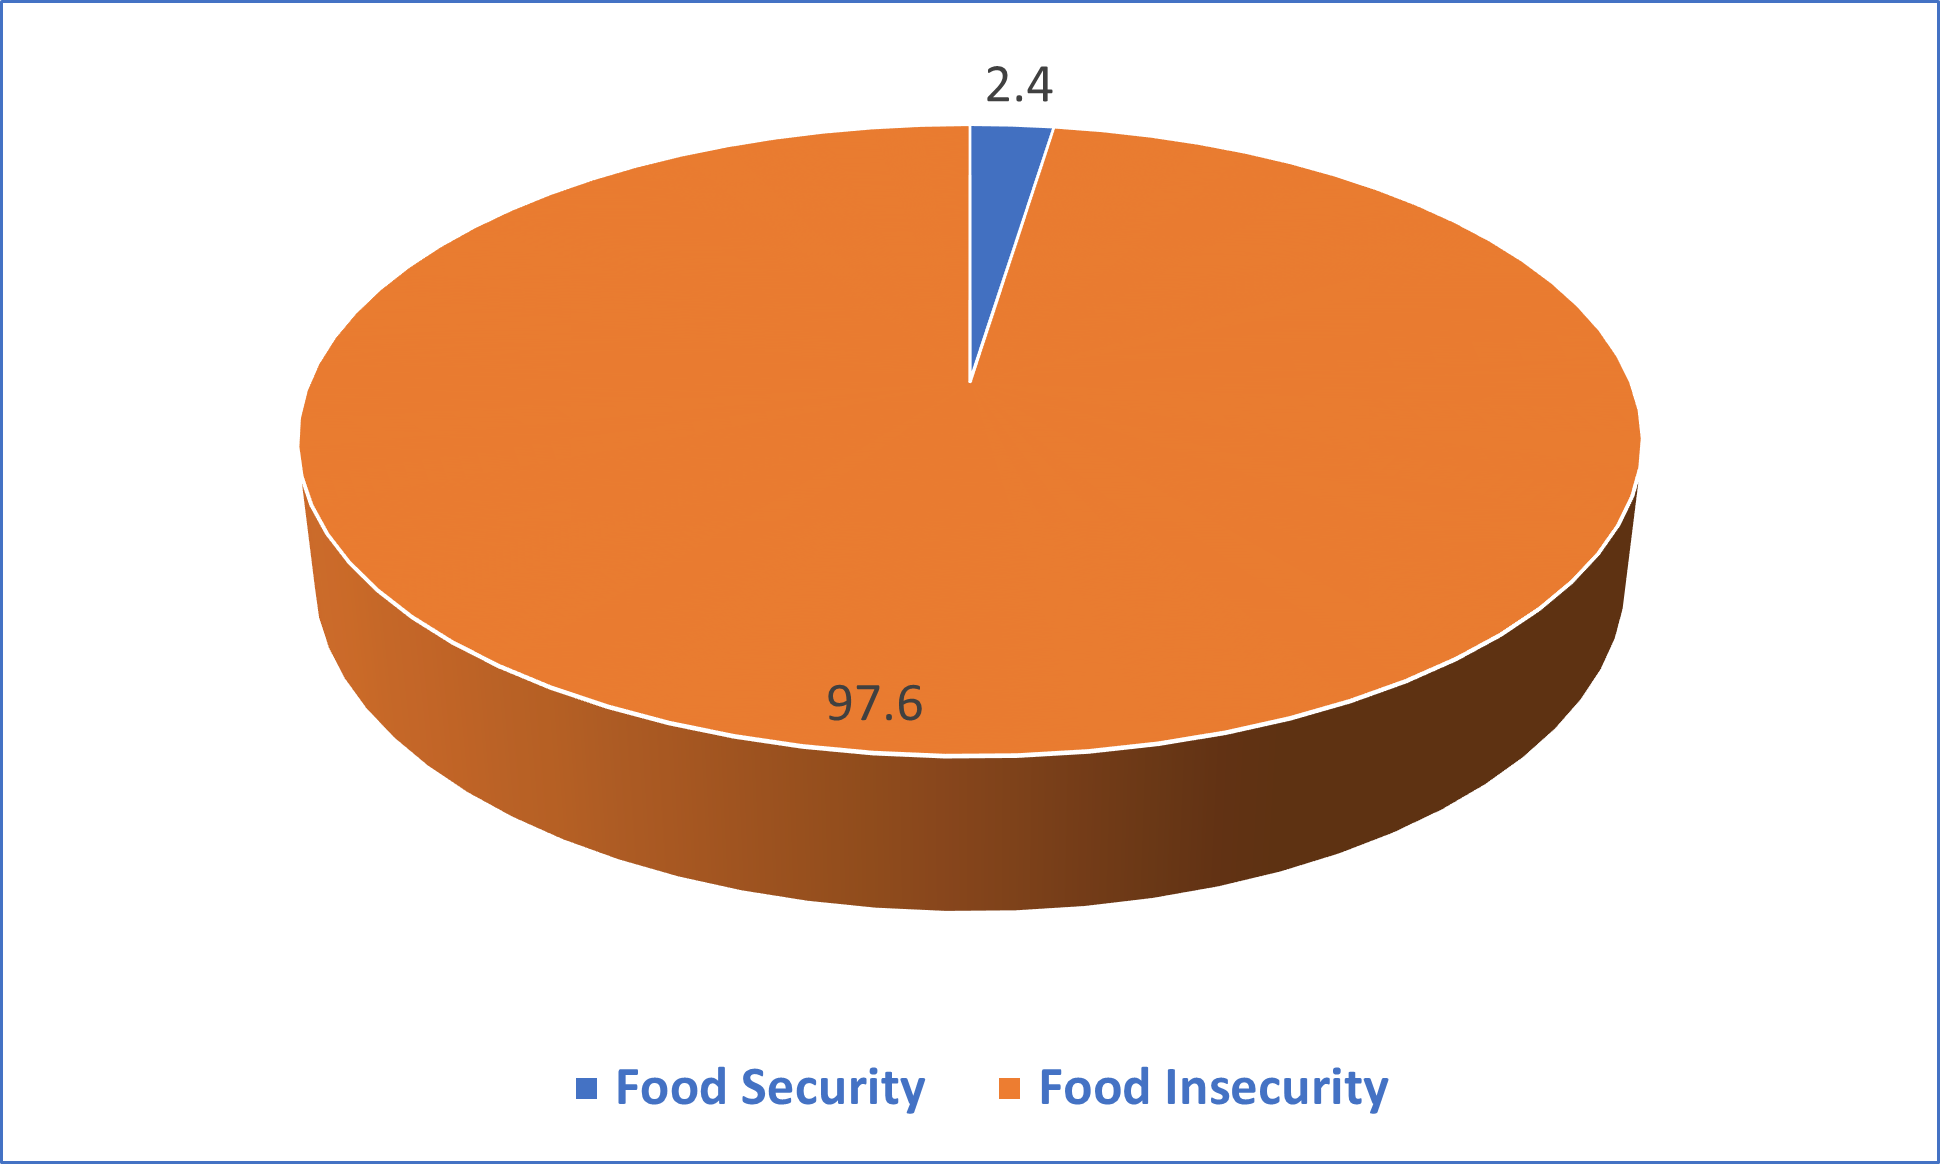
Out of ten households, about one (2.4%) is food secure, while nine (97%) are food insecure.
This table shows that out of ten households, approximately four (41.7%) live in severe food insecurity, and three (33.4%) face very severe food insecurity. Only less than one in ten households (2.4%) is food secure, highlighting the importance of urgent interventions to improve access to adequate food.
This table reveals that 52.8% of respondents are under 28 years old, with no significant difference in food security (p = 0.52). Similarly, educational level (p = 0.53), marital status (p = 0.86) and daily food expenditure (p = 0.6) do not significantly influence food security. These observations suggest that none of the factors examined have a statistically significant relationship with food security in this population.
This table reveals that the majority of food-secure households have limited (45.5%) or adequate (45.5%) food consumption. Among food-insecure households, 49.7% have adequate consumption, 41.8% have limited consumption, and 8.5% have poor consumption. These results indicate a high prevalence of food insecurity, regardless of the food consumption score .
DISCUSSION
Summary of findings
The study highlights a critical food insecurity situation in Kalomba Health Zone, where only 2.4 % of households are food secure, while 97 % face insecurity, 41.7 % severely and 33.4 % moderately insecure. Households rely primarily on cereals and tubers (82.7 %) and fresh vegetables (82.8 %), whereas dried vegetables (3.9 %), fruits (5.7 %) and dairy products (1.4 %) are rarely consumed, revealing a nutritional imbalance. Moderate consumption of animal protein (44.3 %) and frequent use of oils (89.3 %) contrast with limited sugar intake (21.1 %). Although 49.7 % of insecure households display an “adequate” consumption score, this highlights the limitations of interpreting dietary diversity alone without considering food access and stability dimensions captured by HFIAS.
Eating habits in households in the Kalomba Health Zone
Dietary patterns in Kalomba remain skewed toward energy-dense but micronutrient-poor foods. The over-reliance on fufu and leafy vegetables limits essential nutrient intake, especially proteins, vitamins, and minerals critical for child development and maternal health. The Food Consumption Score (SCA) reveals that 41.9 % of households have borderline diets and 8.5 % have poor consumption. These findings are consistent with ACF’s 2018 assessment in Nangua-Boguila (CAR),17,18 which reported repetitive diets centered on cassava and leaves due to poverty and limited availability. Similar results from Nigeria19–22 and South Africa14,23–26 emphasized how financial constraints undermine dietary diversity. While caregivers may attempt to maintain food variety, chronic resource shortages prevent sustainable nutrition improvements.
Moreover, gender dynamics play a central role. Mothers and caregivers bear the burden of managing scarce resources, often prioritizing children’s meals over their own. Despite limited access, their efforts ensure baseline calorie intake, but not the nutritional quality needed for healthy growth. These results support a gender-sensitive response that strengthens women’s agency in nutrition decisions through targeted education, income support, and resilience planning.
Food security in households in the Kalomba Health Zone
The coexistence of high HFIAS-rated insecurity with “adequate” consumption scores in half of the insecure households raises important interpretive questions. The HFIAS measures stress, uncertainty, and reductions in food quantity or quality, while the SCA records frequency and diversity. Therefore, households may consume diverse foods occasionally but still experience consistent insecurity due to price fluctuations, seasonal shortages, or coping strategies such as skipping meals. This underscores the importance of triangulating both indicators for a multidimensional understanding of food vulnerability.
Findings align with Kalonda Kanyama’s study around Kananga, showing 73.6 % household insecurity with 47.8 % in severe conditions.27,28 Kongolo similarly reported worsening food access due to reduced production and high prices. Sané and Ruvimbo14,15 identified conflict and climate shocks as aggravating factors, while16 noted supply chain collapse. In Kalomba, although agriculture, livestock, and trade form the economic base, access to protein-rich foods such as fish, caterpillars, and meat remains limited. The legacy of the Kamuina Nsapu conflict has deepened socioeconomic instability, diminishing households’ capacity to adapt.29,30
Long-term recovery calls for inclusive policies, increased local production, and food system strengthening. This must go hand-in-hand with community resilience programs, infrastructure rehabilitation, and a commitment to nutrition-sensitive agriculture. Local leadership, supported by NGOs and international partners, must prioritize access, affordability, and awareness to rebuild food sovereignty in Kalomba.
Limitations and strengths
The study provides valuable insights through a representative sample and comparative framing in a post-conflict context. However, limitations include reliance on self-reported data and a cross-sectional design, which may introduce bias and hinder causal inference. Discrepancies between food security (HFIAS) and consumption scores reflect measurement limitations. Seasonal variation, infrastructure access, and cultural practices were not assessed, affecting generalizability. These gaps underscore the need for longitudinal, multisectoral research to better understand and address household food insecurity.
Conclusions
This study exposes severe food insecurity in post-conflict Kalomba, with only 2.4 % of households food secure. Heavy reliance on staples and low protein intake heighten nutritional risks. The findings call for targeted actions—supporting household agriculture, diversifying crops, empowering women, and strengthening local markets to restore resilience and guide urgent, inclusive interventions.
Acknowledgements
The authors warmly thank the steering committee of the Kinshasa School of Public Health for its support, as well as the facilitators for their constant support throughout the research and writing process.
Funding
This study did not receive any specific external funding. It was carried out using the research team’s personal resources, with institutional support from the Kinshasa School of Public Health.
Authors’ contributions
-
André Balamuange designed the entire study, supervised data collection, and wrote the master’s thesis from which this article is based.
-
Bernard-Kennedy Nkongolo provided his expertise in nutritional analysis and contributed to the development of the scientific discussion.
-
Branly Mbunga and Marc Bosonkie facilitated the writing process by proposing methodological adjustments to the initial protocol and guiding the finalisation of the manuscript.
Conflicts of interest
The authors declare that they have no conflicts of interest to report.


