
BACKGROUND
The burden of preventable maternal and perinatal deaths remains substantial globally. Progress towards improving survival has stagnated, resulting in 287,000 maternal deaths and 2.3 million neonatal deaths globally in 2021.1,2 In Nepal, the maternal mortality ratio (MMR) was estimated at 239 per 100,000 live births in 20163 and 151 in 2021.4 Nepal has reported considerable increases in the use of maternal health services; however, the reduction in maternal and newborn deaths has not been proportionate to expected declines.5,6 The percentage of births in health facilities in Nepal increased from 64.0% in 20163 to 79.0% in 2022.7 Similarly, the percentage of childbirths attended by skilled providers rose from 65.0% in 2016 to 80.0% in 2022.3,7 Despite this significant increase in childbirths in health facilities, efforts to reduce maternal mortality have been slow.8 Given the ambitious targets of the Sustainable Development Goals (SDG) to reduce the global maternal mortality ratio to less than 70 per 100 000 live births,9 there is an urgent need for increased efforts focused on enhancing the quality of maternal health care.
Improving access to facility-based care is unlikely to effectively reduce maternal and perinatal deaths if the quality of care remains poor.10–12 Reducing MMR relies significantly on competency of skilled health personnel,13 complemented by enabling environments for quality childbirth services.14–16 An enabling environment comprises sufficient supplies, equipment, medicines, infrastructure, competent health providers, an effective system for communication, transportation, and referral, as well as a supportive policy and regulatory framework.17,18 Attaining better maternal and perinatal health outcomes requires improvements in these enabling environment indicators for quality care.19
In a study conducted across five African countries, the quality of basic maternal care was measured using an index that included 12 indicators of the structure and processes of care, such as staff availability, electricity, safe water, infection control resources, and the utilization of routine and emergency obstetric care interventions in healthcare facilities.20 Another study of 17 low- or middle-income countries examined 23 essential items for obstetric and newborn care, categorized into four domains: 1) general requirements, 2) staff and guidelines, 3) equipment, and 4) medicines and commodities.21 These studies found substantial gaps in the availability of key services and equipment for childbirth. Enhancing enabling environments through initiatives such as childbirths with skilled birth attendants, innovative mobile ambulances, and conditional cash transfer schemes has led to reduced maternal mortality.22
Crude intervention coverage, such as the percentage of births in health facilities, does not account for quality of care. The concept of effective coverage is increasingly being used to account for service quality in calculating intervention coverage.23 Effective coverage integrates the dimensions of the need for, use, and quality of care.23,24 The few studies on effective coverage of maternal and child health services have shown significant reductions in crude intervention coverage when factoring in quality of care. For instance, in Ghana, when facility data was linked to population data by districts, it was discovered that two-thirds of all births occurred in a health facility, but only one in every four births took place in facilities providing high-quality care.25
There is a growing focus on research concerning effective coverage, but its scope remain limited.26,27 Additionally, evidence suggests that merging women’s reports of use of care captured on household survey data with facility survey data can provide a broader picture to understand the gap between crude and effective coverage of high quality maternal and perinatal health services.28 Therefore, achieving the ambitious targets of the SDG9 requires not only increased institutional childbirths but also an enabling environment for quality childbirth services in health facilities. This study adds to the broader global discussion on health systems strengthening and improving maternal and newborn health outcomes. The primary aim of this study to estimate the effective coverage of facility-based childbirth, highlighting the gaps between the availability of services and the percentage of childbirths occurring in quality environments in Nepal.
METHODS
Study setting, study population and sample
Data from the Nepal Demographic and Health Survey (DHS) 2022,7 a cross-sectional, nationally representative household survey, was used for this study. The DHS employed a multi-stage cluster sampling design. In the first stage, primary sampling units (PSUs) were selected proportionally to their size, and a household listing was done in each PSU. In the second stage, 30 households were selected from each cluster, resulting in a total sample size of 14,280 households. Interviews were completed with 14,845 women aged 15-49 years at the time of the survey. Detailed information on the survey methodology, including the sampling procedure and data collection, is described and documented elsewhere.7 In our study, we included all women ages 15-49 who had given birth (live birth or stillbirth) in the two years preceding the survey, making a total sample of 1,977 women. We chose to focus on births in the two years preceding the survey to better align with the Nepal Health Facility Survey (HFS) 2021 data, which were collected at the approximate mid-point of this two-year recall period. We extracted data on women’s characteristics and self-reported place of birth (facility type) and person assisting (health provider) with their most recent birth.
We used HFS 202129 data, the second such survey to offer nationally representative findings by facility type and by province. In the 77 districts across Nepal, the HFS gathered data from a sample of facilities managed by the government, private non-profit NGOs, private for-profit organizations, and mission/faith-based organizations. The facility types included hospitals (both government and private), primary health care centers (PHCCs), health posts (HPs), urban health centres (UHCs), community health units (CHUs), and stand-alone HIV testing and counselling centres (HTCs). Facilities were stratified by type within each province and randomly selected. The effective sample size was 1,626 after excluding eight duplicated facilities. The survey methodology, including the sampling procedure, data collection are described and documented in detail elsewhere.29 We extracted data on inventory and types of health providers conducting childbirth in facilities. In our study, we included all government hospitals (federal, provincial, and local), private hospitals, PHCCs, HPs, CHUs and UHCs which offered childbirth services, with a total sample of 804 facilities.
Definition of variables
For the DHS data analysis, we used the socio-demographic variables such as age, residence, province, education, ethnic group, religion, wealth quintile, and place of birth and person assisted during childbirths. We re-coded the groupings of maternal age at index birth in years (<20/20-34/35-49); ethnic group (Brahmin or Chhetri/ Madhesi/Dalit/Janajati/others) and religion (Hindu/Buddhist/ Muslims/ Christians/ others). The existing DHS categories for place of residence (urban/rural), province, education level (no education/basic/secondary/ higher), and household wealth quintile were used.
For the HFS analysis, indicators for the enabling environment for routine births included commodities and equipment considered essential for provision of routine childbirth care and appropriate response to potential complications based on available evidence.21,30 We defined the indicators for a facility’s enabling environment to provide basic emergency obstetric and newborn care (BEmONC) to comprise the indicators for routine childbirth and seven signal functions, and for comprehensive emergency obstetric and newborn care (CEmONC) with nine signal functions31 as described in Table 1. These indicators were used to assess the enabling environment in facilities, ranging from lowest to highest capability: routine childbirth care, BEmONC and CEmONC. We did not apply time restrictions for how recently the health facility reported performing the BEmONC or CEmONC signal functions, only whether the facility reported ever performing the signal functions.
To combine the DHS and HFS datasets, we harmonized the response options of facility type and health provider referring to the Nepal’s category in previous study,32 as presented in Table S1 of the online supplementary document. In the HFS, the various cadres of health providers performing childbirth services were doctors (medical officers, doctor in medicine and general practice, obstetricians/ gynecologist); nurses or midwives or auxiliary nurse midwives (ANMs); and health assistants and other non-skilled persons. In our study, doctors (including obstetricians/gynecologist) and nurses/ANMs were considered as skilled birth attendants (SBA), as defined by HFS, presented in Table S2 of the online supplementary document. In the HFS, health providers performing delivery services were asked to report whether and how recently they had received childbirth care training on a range of topics, including SBA training.29 Our analysis focused on health providers who reported having received the SBA integrated management of pregnancy and childbirth (SBA training) among those who underwent any childbirth care training, as presented in Table S3 of the online supplementary document.
Data analysis
Descriptive statistics, including percentage calculation, tabular and graphical presentation, were performed using Statistical Package for the Social Sciences (SPSS) version 26. We conducted a descriptive analysis of the DHS data to calculate the percentages and 95% confidence intervals (CI) of births by facility type and health providers, and a descriptive analysis of the HFS data to calculate the percentage of facility types with an enabling environment. Additionally, we calculated the percentage of health providers who received SBA training, by cadre, as displayed in the Table S2 of the supplementary document. We combined the DHS and HFS results and multiplied them to estimate the percentage of births in different facility types with an enabling environment and the overall effective coverage of facility-based births in an enabling environment, for routine, BEmONC and CEmONC in Nepal. The combination was performed by matching the health facilities between the household and facility datasets, presented in Table S1 of the online supplementary document, and effective coverage was calculated at the population level. We linked each woman with the average performance of the facilities by facility type where she gave birth which is considered as the standard method for linking women’s reported data from the household survey to the health facility where childbirths were conducted, as performed in a previous study.33 Afterward, effective coverage tabulations at the population level were calculated. The SPSS file was imported into R Studio for calculating the 95% confidence intervals for proportions. All analysis of both the DHS and the HFS accounted for the complex survey design.
Ethical considerations
We used publicly accessible, anonymized survey data of Nepal. Both the USA’s ICF International Ethics Committee and Nepal’s Health Research Council granted approval for the surveys (DHS and HFS). Before the interview, participants’ informed consent was sought and acquired. Anonymity and confidentiality of participants’ and facilities’ identities were maintained in both surveys, following ethical standards.7,29 The authors of this study requested to use the datasets from the DHS program, and after assessing the purpose of our study, the DHS program granted us access to the datasets, which were unrestricted for the study.34
RESULTS
PART A: Demographic and Health Survey (DHS)
The distribution of births by place of delivery and the person assisting the birth, categorized by socio-demographic characteristics, is presented in Table 2. In terms of place of birth, higher-educated women reported performing childbirths at government hospitals, 46.2% (95% confidence interval=35.6%-56.9%) and private hospitals, 44.0% (95% CI=33.7%-54.7%), compared to lower-level facilities, as shown in Table 2B. The poorest women, 34.8% (95% CI=30.4%-39.5%) gave birth at health posts, followed by birth at home, 31.0% (95% CI=26.8%-35.6%) and at government hospitals. Many women from rural areas gave birth at home, 20.2% (95% CI=17.3%-23.4%), whereas urban women were more likely to give birth at hospitals. Regarding types of assistance during childbirth, many women residing in rural areas had their births attended by non-SBA providers, 20.2% (95% CI=17.3%-23.5%), while women residing in urban areas had by doctors, 43.5% (95% CI=40.8%-46.3%). Higher-educated women predominantly reported childbirth assistance by doctors, 70.3% (95% CI=59.7%-79.2%), and a similar pattern was observed among women from the richest wealth quintile. In contrast, non-educated and poorest women had their childbirth assisted by non-SBA providers, 36.5% (95% CI=31.6%-41.7%) and 32.2% (95% CI=27.9%-36.8%), respectively, as shown in Table 2C.
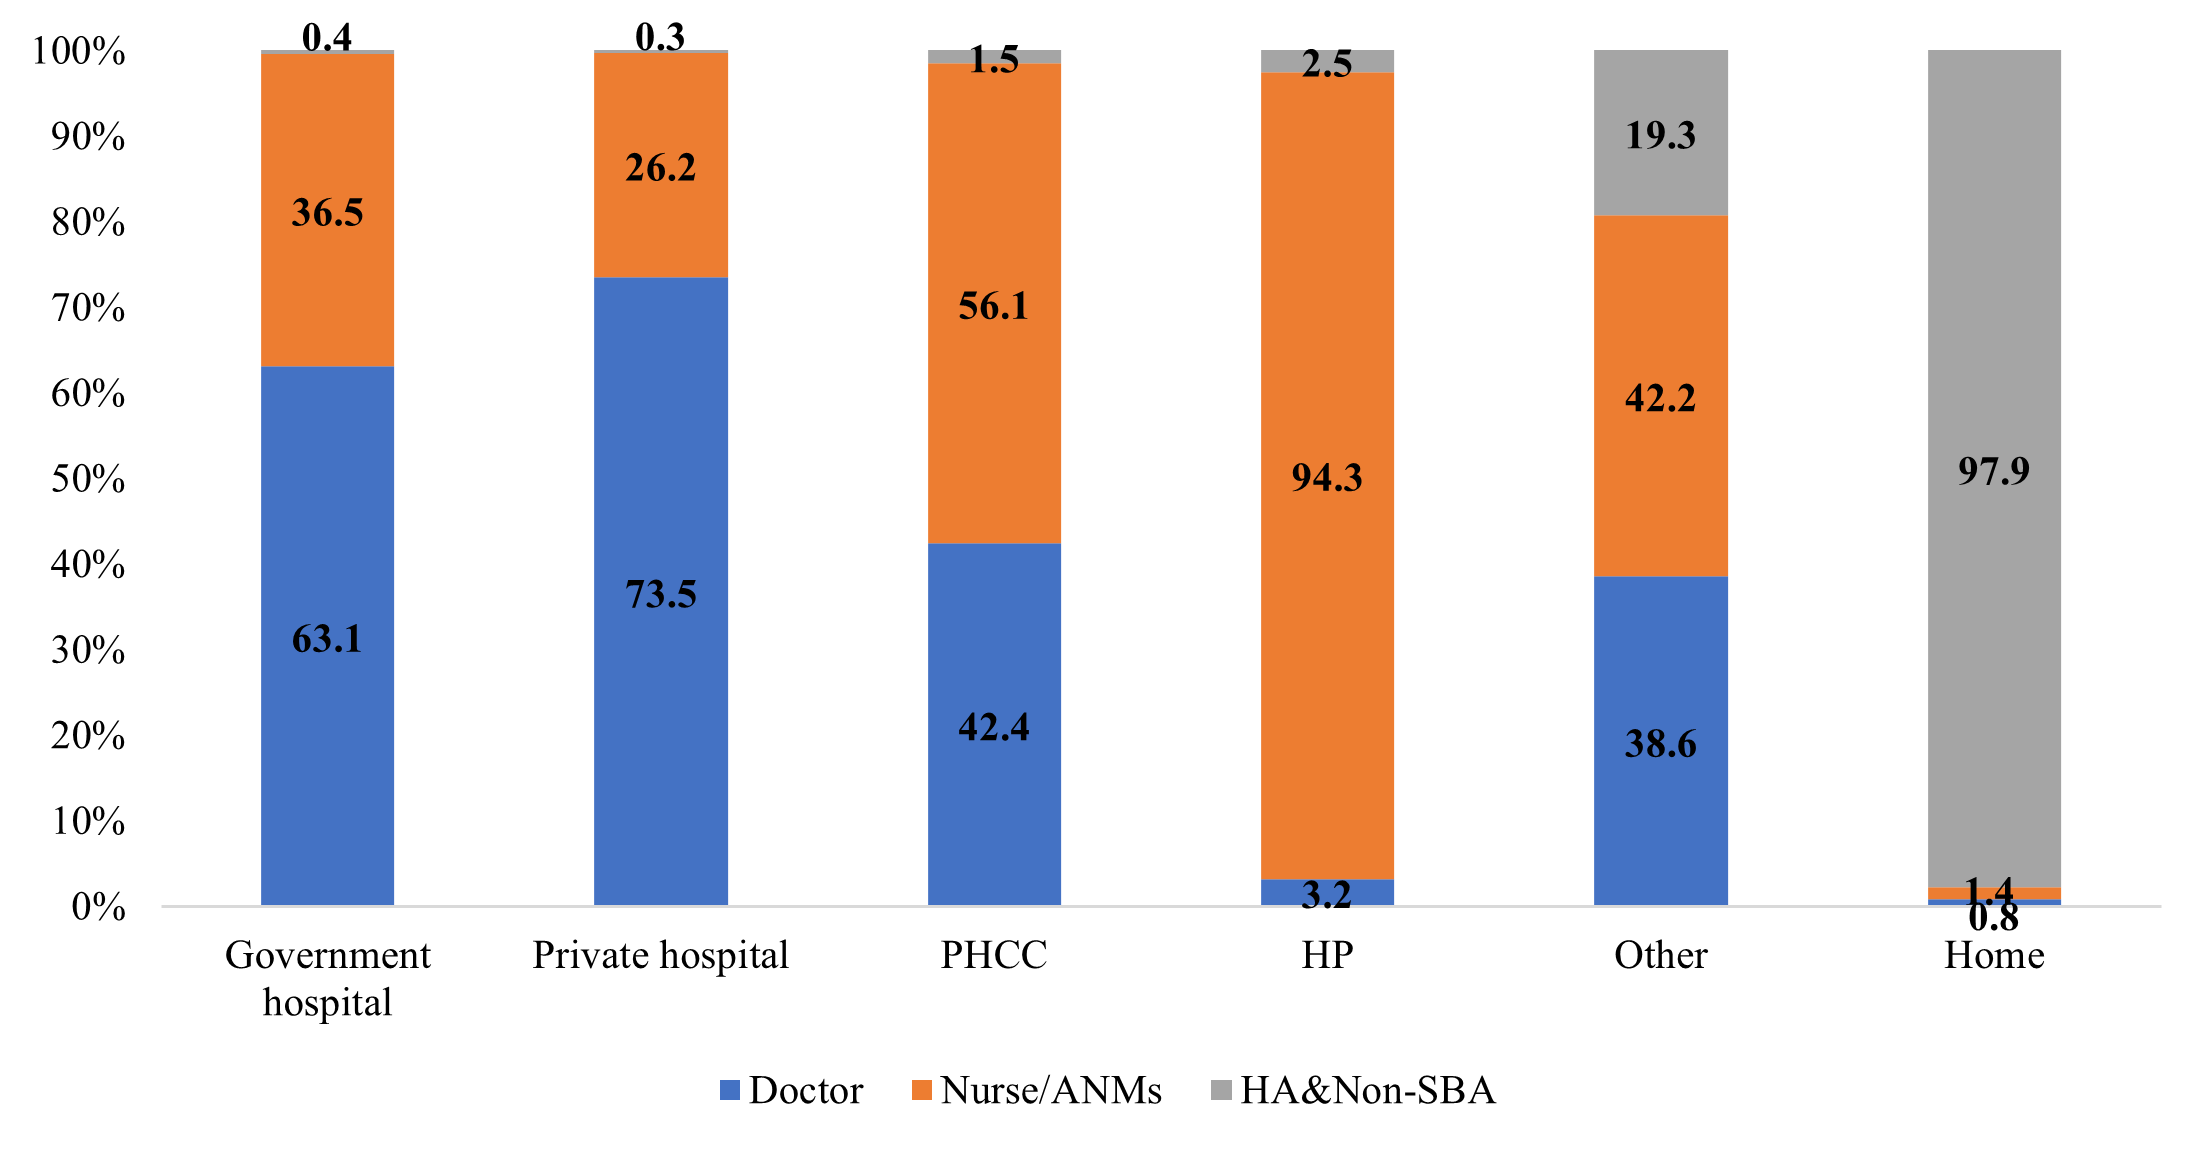
Overall, 79.6% of all births were in a facility and with SBA: 36.8% of births were in government hospitals with SBA, 16.1% of births were in private hospitals with SBA, 3.2% of births were in PHCC with SBA, 20.1% of births were in health posts with SBA, and 3.4% in other types of facilities with SBA. Less than 1.0% of women reported childbirth in a facility but with a non-SBA provider, as presented in Table S4 of the online supplementary document. The percentage of births by person and place (health provider and facility type) is presented in Figure 1, based on DHS. Among women giving birth in government hospitals, 63.1% were with doctors and 36.5% were with nurse/ANMs. Similarly, among women giving birth in private hospitals, 73.5% and 26.2% of births were with doctors and nurse/ANMs, respectively. Among women giving birth in health posts, 94.3% were with nurse/ANMs. However, nearly all of births at home were with either a health assistant (HA) or other non-SBA providers (97.9%).
.png)
PART B: Health Facility Survey (HFS)
Out of the 1,565 surveyed facilities, 804 (51.3%) reported providing childbirth services. Among facilities offering childbirth services, the majority (75.7%) reported were health posts, followed by 7.6% private hospitals, 6.2% PHCC, 5.3% other facilities (CHU and UHC), and 5.2% government hospitals.
The percentage according to the indicators of enabling environment to perform routine childbirth, BEmONC and CEmONC, by facility type, is shown in Table 3. Around 37.0% (95% CI=22.6%-53.1%) of government hospitals, 29.5% (95% CI=18.9%-42.7%) of private hospitals, and 10.0% (95% CI=3.7%-22.6%) of PHCCs had all 24 essential indicators for an enabling environment to conduct routine childbirths. However, none of the health posts or other facilities met all indicators.
Similarly, for the facilities with enabling environment indicators for BEmONC and CEmONC, 24.4% (95% CI=12.9%-40.6%) of government hospitals and 24.2% (95% CI=14.6%-37.0%) of private hospitals had all BEmONC indicators. Only 23.8% (95% CI=12.6%-39.8%) of government hospitals and 23.0% (95% CI=13.5%-35.8%) of private hospitals fulfilled all indicators for CEmONC. Although PHCCs and lower level facilities such as health posts, CHUs and UHCs are not expected to be enabled for BEmONC and CEmONC environments, 2.0% (95% CI=0.1%-12.0%) of PHCC were equipped with all BEmONC indicators, as presented in Table 3.
PART C: Combining DHS and HFS
The effective coverage of facility births, in an enabling environment and with SBA for routine childbirth, BEmONC and CEmONC, is shown in Figure 2. The calculation details are provided in the Table S5 of the online supplementary document.
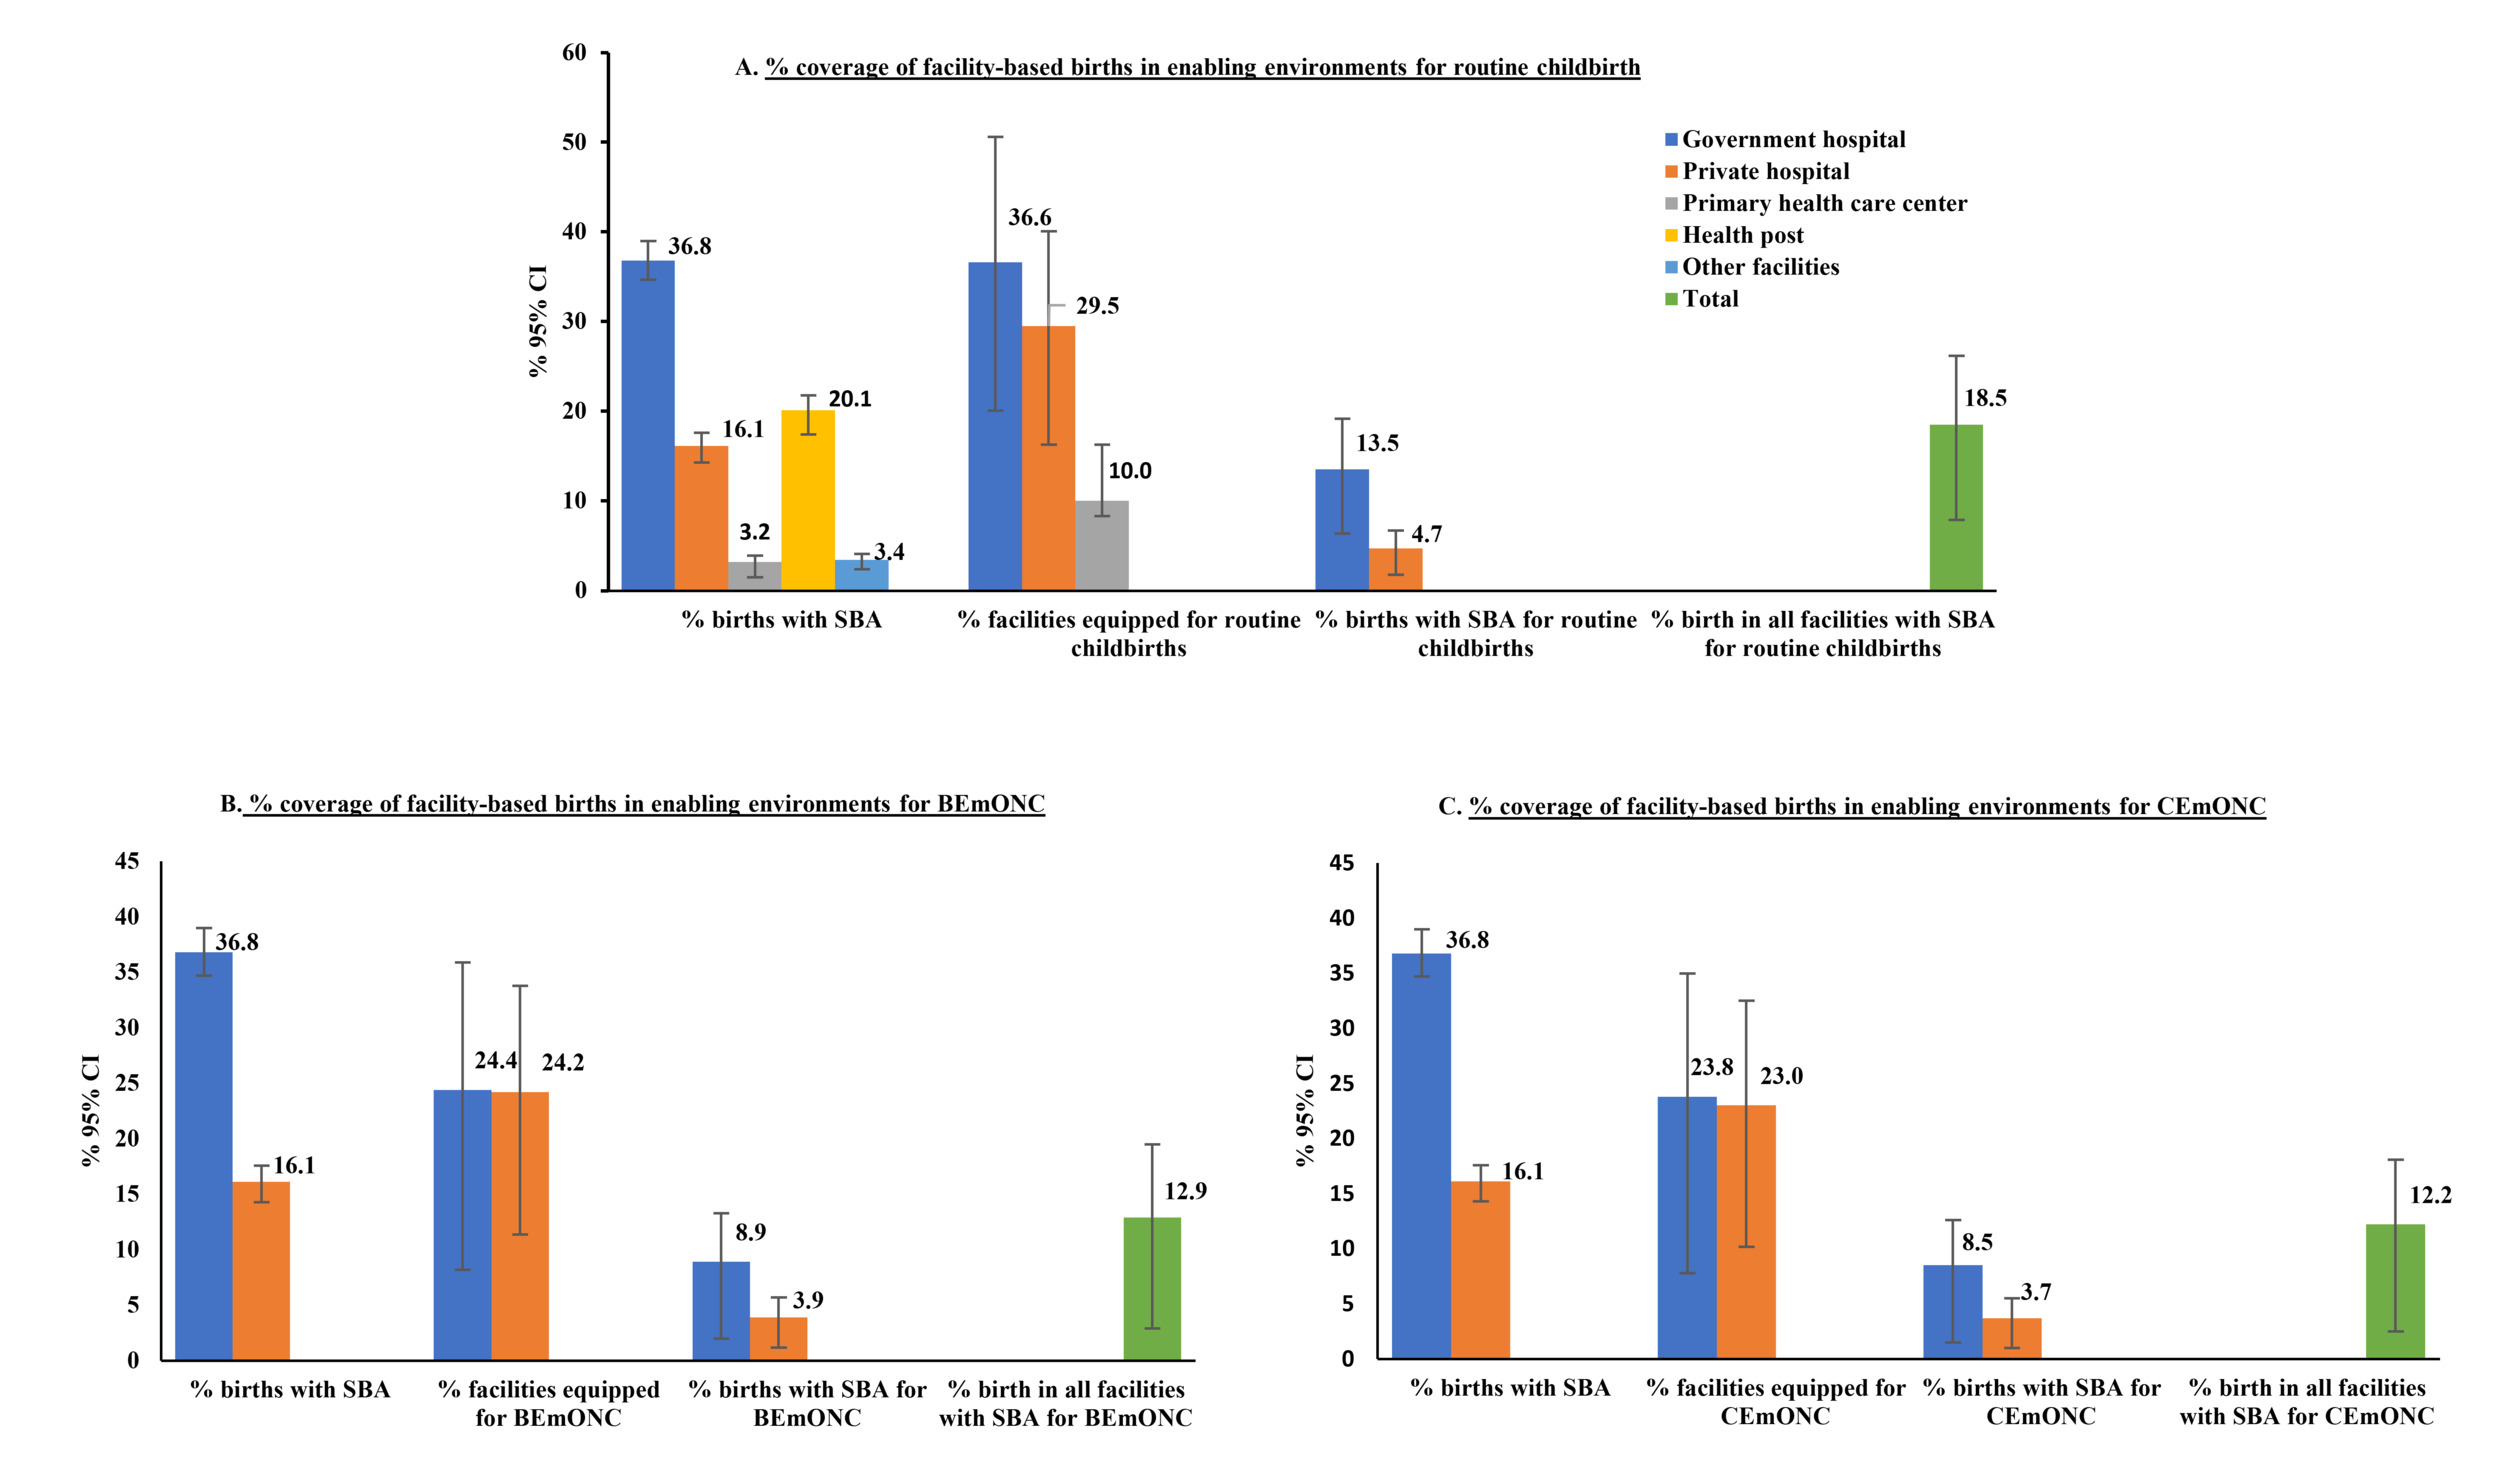
By combining the estimates from the DHS and the HFS, we found that the overall effective coverage of births in health facilities equipped for routine childbirth and with SBA was 18.5% (95% CI=10.8% - 29.1%) in Nepal. This coverage further dropped to 12.9% (95% CI=6.6% - 22.9%) for births in facilities equipped for BEmONC and to 12.2% (95% CI=6.3% - 21.9%) for CEmONC. In government hospitals the coverage of births in environments equipped for routine childbirth with SBA reduced from 36.8% to 13.5%, in private hospitals from 16.1% to 4.7%, in PHCCs from 3.2% to 0.3%, and in health posts from 20.1% to 0.0%. Further reductions were observed when BEmONC and CEmONC was included, as shown in the Figure 2.
DISCUSSION
This study combined Nepal’s most recent DHS and HFS7,29 to estimate coverage of facility-based births with skilled attendants in enabling environments for routine childbirth, BEmONC and CEmONC. We found that while 79.6% of all births in Nepal occurred in health facilities with SBAs, only 18.5% took place in health facilities equipped for routine childbirth, and even fewer births (12.9%) occurred in health facilities with SBAs for BEmONC and CEmONC (12.5%) functionality.
Our findings suggest that women who gave birth in healthcare facilities did not always receive high-quality childbirth care, as only a small proportion of facilities were adequately equipped to handle routine childbirths or provide BEmONC and CEmONC. Despite accounting for nearly a quarter of all births, no lower-level health facilities (health posts and below) had enabling environments to conduct routine childbirths. As other studies have identified, service contact does not guarantee that facilities are ready and equipped to provide quality care.32,35–40
Our study showed that the effective coverage of facility births with SBA in Nepal was substantially lower than crude coverage. The reductions across facility types were due to the unavailability of all essential infrastructure, equipment, medical supplies, and skilled birth attendants to provide childbirth services. Comparable results were observed in a study carried out in six different countries, revealing that the effective coverage of facility-based birth fell significantly short of the crude coverage.32 The extent of this decline varied, ranging from 20.0% reduction in Nepal, based on data from 2016 DHS3 and 2015 HFS,41 and 39.0% reduction in Haiti.32 A study in Tanzania reported the effective coverage of facility-based childbirth to be 0.0% when applying a stringent criterion requiring 90.0% completion of essential elements. However, with a more lenient standard of 50.0% completion of elements, the effective coverage reached 25.0%.35
In our study, most health facilities lacked at least one of the indicators required for routine childbirths, BEmONC and CEmONC. The most commonly unavailable indicators included communication services (functioning telephone or cell phone), a manual vacuum extractor, and vacuum aspiration kit in many lower level facilities. Similarly, suction apparatus, injectable antibiotics and injectable magnesium sulphate were missing in many lower-level health facilities such as health posts, UHCs and CHUs. We considered all 24 indicators as important in an enabling environment for performing routine childbirth. If any of these indicators are missing when needed, it may result in a failure to provide timely quality service. It is not a case that some facilities were well-equipped, and others were poorly-equipped; rather, most facilities had some missing or deficient items crucial for providing quality childbirth services when required. On average, only one-fifth of government hospitals, private hospitals, and PHCCs had all the indicators for routine childbirth. However, fewer than one-fifth of health posts and other facilities had all these indicators. Among the BEmONC signal functions, assisted vaginal delivery was not available in more than two-thirds of government and private hospitals, and in one-fourth of PHCCs. Many health posts and other facilities lacked parenteral administration of antibiotics and anticonvulsants for managing hypertensive disorders of pregnancy. Inadequate infrastructure support, such as buildings, roads, transportation, logistics, and equipment procurement supply issues, limits the availability of all enabling environment indicators for lower-level health facilities in Nepal.42 All included facilities in this study, including health posts and lower facilities, are officially designated to provide childbirth services. Addressing deficiencies in routine and complicated births’ indicators is essential for providing safe, high-quality childbirth care, which positively impacts maternal and neonatal health outcomes. Possessing a supportive setting with functional equipment, sufficient medications, and skilled staff does not necessarily ensure clients will receive exceptionally high-quality care.43,44 The service readiness criteria and indicators examined in this study do not encompass every facet of care quality, such as respectful women-centered care, client satisfaction, provider proficiency, and adherence to obstetric standards. Additionally, factors such as accessibility and affordability can hinder the creation of an enabling environment and the provision of quality care.45 Therefore, it is likely that even fewer women and babies receive the high quality of childbirth services than we estimated in our effective coverage results. It is also crucial to reach an agreement on standard indicators for the enabling environment and to devise novel approaches for assessing the quality of maternal and newborn health interventions over time, both locally and globally.
Without additional information on service quality, global metrics like the prevalence of facility-based birth may provide an inflated view of progress in maternal health outcomes. Evidence suggest that an increased demand for and accessibility to births in health facilities does not necessarily correlate with facilities being adequately prepared to offer high-quality obstetric services, and to make strides in reducing maternal and perinatal mortality.21 It is essential to prioritize quality of maternal and child health services, while simultaneously striving to expand service accessibility to underserved populations.46 Capacity-building initiatives for healthcare providers, improved resource allocation strategies to strengthen infrastructure, and policy-level interventions to enhance service delivery, particularly at lower-level health facilities, are recommended.
Strengths and Limitations
Combining population and facility-based data offers a promising approach for comprehensive assessments of intervention coverage and healthcare quality. It addresses limitations of household surveys and can yield population-based estimates reflecting service use, care quality, and potentially health benefits.47–49 In this study, we restricted our analysis to women who gave birth in the two years before the survey to temporally align with the HFS and enhance the likelihood that the facility environments described in the facility survey remained relatively unchanged during the recall period. However, this may have introduced information bias from the respondents of both surveys. Combining estimates by facility type from household survey data with data from facility surveys conducted at the right time provides a reliable approximation of estimates achieved through individual facility linkage.33
This study has some methodological and data-related limitations. It is additionally possible to geographically link household and facility survey data, for example by estimating coverage by province and facility type.50 However, as many women in Nepal travel to give birth, crossing administrative boundaries to access facilities outside the area where they live, we opted to combine household and facility survey data based on facility type.
The extent to which women in Nepal can reliably report the specific type of facility, birth attendant or provider where they sought care in household surveys has not been assessed. Evidence from other settings suggests that women can provide more accurate information about the facility, as they often mention the facility name, which is then recoded into a facility type, compared to the specific cadre of provider.28,51
While BEmONC and CEmONC signal functions are standardized, we did not find standard or universally agreed indicators for the enabling environment to conduct routine childbirth, although we included basic and essential items based on the available literature.21,30,31 Our routine childbirth calculation was very sensitive to missing just one of the 24 items. All items were equally weighted, implying that the absence of an examination light is considered as crucial as the absence of a neonatal bag and mask (both are important, but one is life-saving). Further, our calculations may overestimate BEmONC and CEmONC coverage as ever performing an emergency obstetric and newborn care signal function does not mean recent or regular performance. Additionally, the harmonization of categories might lead to misclassification in the estimation of the enabling environment by facility type. The HFS had more specific and discrete response options for facility type and provider assisting, compared to DHS. Although the national surveys have robust sampling methodologies, the harmonization approach may have resulted in underreporting or facility sampling exclusion. We attempted to develop conceptually consistent categories to address these differences, but future surveys should consider how to best align categories to facilitate DHS and HFS combined analyses. What this method doesn’t address, however, is the continued challenges in accurately measuring whether sufficiently skilled health providers are caring for women and newborn. This measurement challenge is unlikely to be solved until there are better measurements of training, registration, regulation of health professionals, and improvements in global health workforce data. Future survey and analysis should also include additional data on availability of neonatal care practices such as facilities equipped with neonatal intensive care units and the presence of trained personnel. Moreover, further analysis delving into rural-urban differences, geographical linkages, and contextual relevance based on healthcare systems at the global level is recommended.
CONCLUSIONS
This study reveals a significant gap between childbirth facility usage and the availability of enabling environments for routine and emergency care in Nepal. Combining data from household and health facility surveys suggest a reality where, at most, two out of every ten births occurred in health facilities with SBA and in an enabling environment to deliver life-saving maternal and perinatal interventions. Our study contributes valuable evidence to policymakers, urging them to focus on improving the enabling environment for childbirth, making it clear that quality of care is a paramount concern for achieving maternal and newborn health goals. On a global scale, these findings highlight the importance of integrating health facility assessments with population-based surveys to accurately measure effective coverage of maternal and neonatal care. Addressing these gaps is essential for reducing preventable maternal and newborn deaths and achieving universal health coverage.
Acknowledgements
We express our gratitude to the Institute of Tropical Medicine (ITM), Antwerp, for awarding a scholarship to the first author to attend the course on “writing paper based on Demographic and Health Survey (DHS) on reproductive and child health.” This opportunity enabled the first author to produce this paper. We acknowledge the partial support from Gates Venture for the additional time contributed to further analysis work. Furthermore, we extend sincerest thanks to Dr. Geetha Rana and Dr. Sameer Mani Dixit for their expert suggestions on the manuscript. The authors also would like to thank the USAID’s DHS program for providing the datasets of the Nepal Demographic and Health Survey and Health Facility Survey.
Ethics statement
We used publicly accessible, anonymized survey data of Nepal. Both the USA’s ICF International Ethics Committee and Nepal’s Health Research Council granted approval for the surveys (DHS and HFS). Before the interview, participants’ informed consent was sought and acquired. Anonymity and confidentiality of participants’ and facilities’ identities were maintained in both surveys, following ethical standards. The authors of this study requested to use the datasets from the DHS program, and after assessing the purpose of our study, the DHS program granted us access to the datasets, which were unrestricted for the study.
Data availability
We used publicly available data from USAID’s DHS program to extract the datasets from the Nepal Demographic and Health Survey and Health Facility Survey (https://dhsprogram.com/data/available-datasets.cfm).
Funding
The author received funding to attend the course on “writing paper based on Demographic and Health Survey (DHS) on reproductive and child health” organized by the Institute of Tropical Medicine, Antwerp, Belgium, and the APC was funded by the same institute. This manuscript is the output of that course.
Authorship contributions
SK led the conceptualization and planning of the study, with input from LPK, ER, and LB. SK wrote the original draft of the manuscript with the input from ER and LB. SK extracted the data and conducted the data analysis with the input from AS, ER, SD and LB. All authors – ER, SD, AS, EYM, YH, LH, AM, LB, and LPK reviewed the manuscript and provided constructive feedback. ER, LB, and LPK provided overall supervision. All authors read, provided feedback, and approved the final manuscript for publication.
Disclosure of interest
The authors completed the ICMJE Disclosure of Interest Form (available upon request from the corresponding author) and disclose no relevant interests. ICMJE declaration forms was collected and kept by the corresponding author.
Correspondence to:
Sulata Karki
HERD International
Bhaisepati, Lalitpur
Nepal
sulatakarki@gmail.com