INTRODUCTION
There is increasing attention and research on how environmental factors influence health outcomes, particularly among ageing populations.1–3 Evidence indicates that air pollution, specifically fine particulate matter (PM2.5), is a leading contributor to an estimated 4.2 million premature deaths worldwide each year.4–6 Unfortunately, a disproportionately high percentage (89%) of these premature deaths occurred in low- and middle-income countries, with the largest burden (approximately one-third) observed in Southeast Asia and the Western Pacific Region6,7
PM2.5 exposure has been linked to a range of adverse health effects, including respiratory and cardiovascular diseases, which can significantly impact life expectancy and quality of life for older adults.5,8 Evidence from scientific literature suggests that air pollution and smoking have a synergistic relationship, making air pollution the second leading cause of lung cancer and worsening survival rates for this illness.9–11 For instance, a study in Taiwan found that over 50% of lung cancer patients had never smoked, highlighting the role of air pollution in contributing to lung cancer risk among non-smokers.11
In this regard, the World Health Organisation (WHO) has recognised air pollution as a significant environmental threat to public health, emphasising the need for targeted interventions, particularly in densely populated locations.6,12 Beyond respiratory issues, growing evidence links PM2.5 exposure to cognitive decline and neurodegenerative diseases such as Alzheimer’s disease and other related dementias.13–16 For instance, a recent Lancet report quantifies air pollution’s contribution to 3% of late-life dementia risk, highlighting its broader impact on ageing populations.17
While the negative health impacts of air pollution are well-documented in the literature, emerging research also suggests that access to urban green spaces is a vital factor in mitigating the detrimental effects of air pollution and enhancing public health. The presence of green spaces can help filter air pollutants, thereby improving air quality and potentially offsetting the negative consequences of PM2.5 exposure.18–20 Through photosynthesis, green plants convert carbon dioxide (CO2) into oxygen (O2), thus improving ambient oxygen levels.21 An increased oxygen availability enhances cellular respiration in humans, improving energy metabolism, healthy cerebral blood flow, optimising brain and overall physiological function.22,23 Green spaces also serve as a valuable resource for older adults. Studies have linked access to public green spaces with various health benefits for this population including improved mental and subjective well-being, increased physical activity and social interaction, lower disability rates, reduced mortality rates, and increased life expectancy.19,20,24–26 Within the WHO framework for an age-friendly environment, open spaces including parks and green spaces, are an important factor in promoting healthy ageing.27 Such benefits are crucial for healthy ageing and maintaining independence in later life.
However, despite the globally proven benefits of green spaces to public health, there is evidence of socioeconomic disparities in access to public green spaces. Lower-income communities often face greater challenges in providing accessible public green spaces compared to their wealthier counterparts, as such access tends to be stratified by factors like income and ethnicity.28–30 Consequently, lower-income cities may have a larger proportion of green spaces that are inaccessible to many residents, limiting the expected health benefits.29 Moreover, scholars argue that even without accessibility and utilisation issues, green public spaces in less affluent locations may be of poor quality, containing elements such as pests or allergens, that potentially pose health risks instead.31
In the context of the Western Pacific region, only a few studies have examined the interplay of mean PM2.5 and access to public green spaces on health to date.19,32,33 However, the relationship between these factors and healthy ageing, especially in lower and middle-income countries in the region, has not been systematically examined. Given that the WPRO is characterised by accelerated urbanisation and industrialisation, rapid population ageing, a disproportionately high burden of air pollution-related deaths, and socioeconomic and health disparities,6,7,34,35 it is of critical importance to investigate the interplay of mean PM2.5 and access to public green spaces on health adjusted life expectancy among the older population. By doing so, this research aims to provide valuable insights into the environmental determinants of healthy ageing in the Western Pacific region, and to the best of our knowledge, is the first of its kind to compare outcomes across various income groups in the region.
Our research endeavour aligns with the World Health Organisation’s efforts to ensure healthy lives and promote well-being for all individuals across all age groups through tailored regional initiatives and programs.36–39 We adopt the WHO’s conceptualisation of healthy ageing as the process of developing and maintaining the functional capabilities that facilitate wellbeing in older adulthood.40 This study defines green spaces as publicly accessible areas characterised by vegetation that offer environmental and health-related benefits, particularly for older adults. They include parks, forests, community gardens, urban green belts, and nature reserves which contribute to cleaner air, social wellbeing, and physical activity. Our findings will inform public health policies and urban planning initiatives that enhance the health and well-being, especially of older adults in the region.
METHODS
Study population
This study employed a population-based approach and analysed data from 21 countries in the WHO Western Pacific Region, with representation from the Lower-Middle-Income Countries -LMICs (Cambodia, Kiribati, Lao People’s Democratic Republic, Federated States of Micronesia, Mongolia, Papua New Guinea, Philippines, Samoa, Solomon Islands, Vanuatu, Viet Nam), Upper-Middle-Income Countries -UMICs (China, Fiji, Malaysia, Tonga), and High-Income Countries -HICs (Australia, Brunei Darussalam, Japan, New Zealand, Republic of Korea, Singapore) country groups. Data were primarily sourced from publicly accessible databases such as those of the WHO (life expectancy database for data on health-adjusted life expectancy (HALE) at 60 and ambient air quality database for data on mean PM2.5 particulate concentration) and the United Nations (urban indicators database for data on green space area). From the diverse data sources for our study, available time series data were utilised for our analysis. These data covered the years ranging from 2000 to 2020 for HALE at age 60; the years 2010 to 2019 for mean PM2.5 particulate concentration, and the years 2000, 2010, and 2020 for green space per capita factors, and were imported into SPSS for influence analysis.
Statistical analysis
The study primarily employed one-way analysis of variance (ANOVA) to evaluate the influence of PM2.5 particulate concentration and green space factors on HALE at age 60 and measure the effect sizes of their influence. According to the United Nations urban indicators database, there are distinct indicators for open spaces and green areas. Our data analysis utilised the data on green area per capita (m2/person), as it offers a more comprehensive assessment of the accessibility and availability of green spaces. Although data on HALE is inherently a continuous variable, it was transformed into ordinal and categorical variables and grouped into different HALE range clusters for our analysis. When examining the impact of each factor on HALE at age 60, post hoc analyses were conducted to determine the specific timeframe or age range during which the factor exerted a positive or negative influence. The one-way ANOVA tests provided the F values and effect sizes η2. The statistical analysis was accompanied by 95% confidence intervals, and a p-value <0.05 was considered statistically significant. Data analysis and visualisation were conducted using SPSS and Microsoft Excel software. Given that our study relied on publicly accessible secondary data from reputable sources, we assumed the data had undergone appropriate cleansing to address missing values and outliers. Furthermore, we conducted statistical tests to validate the robustness of the downloaded data.
The assumptions for one-way ANOVA, including normality and homogeneity of variances, were tested and found to be met. For the variables of HALE at age 60 and mean PM2.5 among WPRO countries, the Kolmogorov-Smirnov test statistics were 0.173 and 0.239, respectively, while the Shapiro-Wilk test statistics were 0.905 and 0.741 respectively. These normality tests were all significant at p < 0.001, indicating that the normality assumption was satisfied. Additionally, the Levene test statistic for mean PM2.5 was 18.221 with p < 0.001, demonstrating that the homogeneity of variance between HALE 60 and mean PM2.5 was met. Similarly, for the variables of HALE 60 and green area per capita among WPRO countries, the Kolmogorov-Smirnov test statistics were 0.153 and 0.125, and the Shapiro-Wilk test statistics were 0.935 and 0.877, all significant at p < 0.001, confirming the normality assumption. The Levene test statistic for green area per capita was 2.292 with p < 0.05, indicating that the homogeneity of variance between HALE 60 and green area per capita was also met.
RESULTS
Table 1 offers a demographic overview of the WPRO countries, highlighting the environmental factors and HALE at 60 years of age.
To assess the sensitivity among the variables, we conducted a Pearson correlation analysis. The Pearson correlation coefficient between the HALE at age 60 and the mean PM2.5 concentration was 0.136 (p=0.049) for all WPRO countries, 0.283 (p=0.029) for HICs, 0.671 (p<0.001) for UMICs, and 0.512 (p<0.001) for LMICs countries. Conversely, the correlation coefficient between HALE at age 60 and green area per capita was -0.009 (p=0.899) for all WPRO countries, -0.307 (p=0.003) for HICs, -0.336 (p=0.007) for UMICs, and 0.002 (p=0.987) for LMICs.
Table 2 shows the influence of PM2.5 and green space availability on HALE across WPRO countries. The analysis involved ANOVA to evaluate the influence effect sizes across WPRO countries, and a standardised formula was applied to calculate normalised scores. This normalisation process transformed the original values of influence effect sizes into a numerical range from 0 (the worst possible outcome) to 1 (the best possible outcome), facilitating a consistent and comparable representation of the variables. For a positively (green area per capita) associated variable, the formula utilised was: Normalised score = (original value - minimum value) / (maximum value - minimum value).
For a negatively associated variable (mean PM2.5), the formula adopted was: Normalised score =1- (original value - minimum value)/(maximum value - minimum value).
These normalisations aimed to rank the countries from high to low positions on the respective variables.
Table 2 shows that across the WPRO countries, the mean PM2.5 particulate concentrations ranged from 7.26 µg/m³ in Tonga to 49.78 µg/m³ in China. A higher PM2.5 concentration was associated with a negative impact on healthy ageing, as the corresponding PM2.5 scores indicated. Countries with higher air pollution levels, such as China (PM2.5 = 49.78 µg/m³, score = 1.0000), Mongolia (PM2.5 = 47.10 µg/m³, score = 0.0648), and the Republic of Korea (PM2.5 = 27.13 µg/m³, score = 0.5328), exhibited stronger negative influence on HALE at age 60. Conversely, countries with lower PM2.5 levels, including Tonga (7.26 µg/m³, score = 1.0000), Fiji (7.27 µg/m³, score = 0.9997), and Australia (7.48 µg/m³, score = 0.9949), showed minimal negative effect on HALE at age 60.
Table 2 also shows that the green area per capita, measured as the square metres of the total green area per person, varies considerably across the countries studied, ranging from 30.5m2/person in the Philippines to 111.92 m2/person in New Zealand. As reflected in the Green Area Scores, the size of the green area was associated with a positive impact on healthy ageing. Countries with larger sizes of green areas, such as New Zealand (111.92 m2/person, score = 1.00), Australia (79.51 m2/person, score = 0.60), and China (75.21m2/person, score = 0.55), exhibited stronger positive influence on HALE at age 60. Conversely, countries with a smaller size of green areas, including Cambodia (44.13 m2/person, score = 0.167), Japan (35.33m2/person, score = 0.059), and the Philippines (30.51m2/person, score = 0.00) demonstrated weaker positive impacts on healthy ageing.
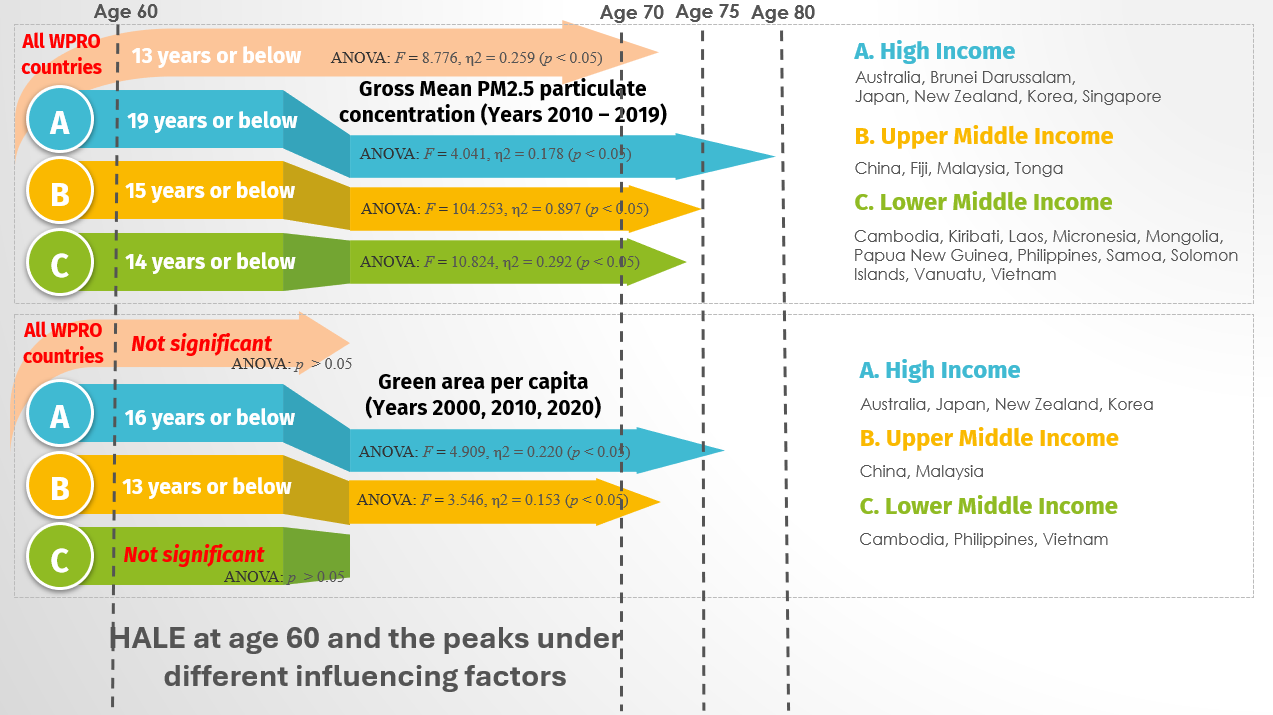
Post hoc analyses to determine the specific timeframe or age range during which specific factors exerted a positive or negative influence are shown in Figure 1. For all WPRO countries, PM2.5 particulate concentration had a negative association with HALE at age 60. However, the extent of the negative association varied across various countries in the region. Figure 1 shows that PM2.5 particulate concentration substantially impacted HALE at age 60 within the WPRO region. Specifically, the influence was significant for 19 years or less (age 79 or below) (F = 4.041, η2 = 0.178, p < 0.05) in HICs, 15 years or less (age 75 or below) in UMICs (F = 104.253, η2 = 0.897, p < 0.05) and for 14 years or less (age 74 or below) in LMICs (F = 10.824, η2 = 0.292, p < 0.05). When considering all WPRO countries, it is generally significant for 13 years or below (age 73 or below) (F = 8.776, η2 = 0.259, p < 0.05).

On the other hand, access to green space was positively associated with Hale in all WPRO countries, with the extent of association varying across countries in the region. The data in Figure 1 also shows that green area per capita had a substantial impact on HALE, being significant for 16 years or below (age 76 or below) in HICs (F = 4.909, η2 = 0.220, p < 0.05) and 13 years or below (age 73 or below) in UMICs (F = 3.546, η2 = 0.153, p < 0.05). However, there is no significant influence when considering LMICs or all WPRO countries.
To examine how annual changes in PM2.5 levels and green space availability impacted HALE at age 60, a linear regression analysis with time lags was conducted. For the regression model predicting HALE at age 60 from mean PM2.5 concentrations, the combination of lag-3 (meaning 3 years ago), lag-5 (meaning 5 years ago) and lag-9 (meaning 9 years ago) produced the best-fit model, with an R-squared value of 0.927 indicating that 92.7% of the variance in HALE can be explained by mean PM2.5. The Durbin-Watson test statistic was 2.093, falling within the acceptable range of 1.5 to 2.5 to ensure no autocorrelation. The predictions from this regression equation are considered reliable. The proof-tested regression equation was:
HALE at age 60 = 10.684 - 31.108 x (log-transformed mean PM2.5 | t – 3) + 13.096 x (log-transformed mean PM2.5 | t – 5) + 19.531 x (log-transformed mean PM2.5 | t – 9).
Where t is the measured year (for example, when the data set is measured in year 2019, taking t = 2019, then t – 3 = 2016, t – 5 = 2014 and t – 9 = 2010).
The regression model examining the relationship between green area per capita and HALE at age 60 faced some limitations. The Durbin-Watson test statistic was measured between 0.432 and 1.094, falling outside the acceptable range of 1.5 to 2.5 across various lag combinations tested. This suggests that the assumption of zero autocorrelation was violated, potentially compromising the reliability of the model. Due to the limited availability of annual data (years of 2000, 2010 and 2020), the regression model could only be formulated using lag-0 (year 2000), lag-1 (year 2010), and lag-2 (year 2020) variables. The best-performing model, with a Durbin-Watson statistic of 1.094, incorporated lag-0 and lag-2.
To further investigate the relationship between air pollution, green space, and healthy ageing, we conducted a multivariate analysis to examine potential interaction effects between PM2.5 levels and green space availability. This analysis focused on nine WPRO countries - Australia, Cambodia, China, Japan, Malaysia, New Zealand, Philippines, Korea, and Vietnam - as they were the only countries in the region with available data on green space metrics. The purpose was to determine whether the health benefits associated with green space availability may diminish in areas with exceptionally high air pollution levels. Table 3 presents a multivariate analysis examining the influence of mean PM2.5 particulate concentration and green area per capita on HALE at age 60, utilising time series data from the years 2000, 2010 and 2020. All statistical results were accompanied by 95% confidence intervals. A p-value less than 0.05 was considered statistically significant.
The data in Table 3 indicates that the combined influence of PM2.5 concentrations and green space availability had a highly significant influence on HALE (F=360.037, η2 = 0.851, P < 0.001), accounting for 85.1% of the overall variance. Of this combined effect, PM2.5 levels (F=37.577, η2 = 0.703, P < 0.001) explained 70.3% of the variance, while the availability of green spaces (F=4.425, η2 = 0.218, P < 0.001) explained 21.8% of the observed variance.
DISCUSSION
This population-based investigation aimed to evaluate the impact of environmental factors, specifically PM2.5 particulate concentration and green space availability, on healthy ageing across countries in the World Health Organisation’s Western Pacific Region. Our findings revealed that PM2.5 levels were negatively associated with HALE (health-adjusted life expectancy) at age 60 across the region, while greater access to green spaces was positively associated with healthier ageing outcomes. Regarding PM2.5, all WPRO countries exceeded the WHO’s recommended annual mean air quality guideline of 5 μg/m³.41 Notably higher concentrations were observed in countries like China (49.78 µg/m³), Mongolia (47.10 µg/m³), the Republic of Korea (27.13 µg/m³), the Philippines (22.66 µg/m³), Malaysia (21.67 µg/m³), Laos (21.16 µg/m³), and Vietnam (21.13 µg/m³). These levels were associated with lower HALE, suggesting a potential link between air pollution and healthy ageing. Among many reasons, such high pollution levels tend to stem from rapid urbanisation, industrialisation, and dependence on fossil fuels.42,43 For instance, Mongolia’s reliance on coal for heating, particularly during its harsh winter seasons, and China’s heavy industrial base are significant contributors to air pollution, resulting in substantial negative impacts on healthy ageing. For countries with relatively lower PM2.5 concentrations, HALE at age 60 tended to be higher, suggesting a potential relationship between lower air pollution levels and better ageing outcomes.
Our analysis also revealed that while overall PM2.5 levels had a negative impact on HALE at 60 for 13 years or less across WPRO countries, the extent of these associations varied. The impact of PM2.5 concentrations was statistically significant (p>0.05) across all income groups, but the threshold age at which the effect was observed differed. Notably, the impact on HALE was more pronounced and occurred earlier at age 74 or younger in LMICs compared to age 75 or younger in UMICs, and age 79 in HICs. This finding suggests that with increasing national income classification, countries may exhibit greater resilience to the effects of air pollution on healthy ageing. This resilience may be attributed to more economic resources and policies such as stronger public health systems, better access to preventive care, robust environmental regulations, more comprehensive urban planning, and greater investment in renewable energy sources to mitigate the negative population health impacts of air pollution.44 Moreover, advocacy campaigns over climate and pollution issues are more prominent in high-income countries, for example, Australia’s Climate Council.45 In contrast, countries in lower-income categories tend to experience a disproportionate burden from air pollution due to fewer regulatory controls and limited public health interventions.46,47 These findings reflect the compounding health risks from prolonged exposure to air pollution especially in less wealthy countries, and align with previous research demonstrating the detrimental effects of fine particulate matter on public health, especially later life across the region.5–8
We also found that greater availability of green spaces was consistently linked to higher HALE across the WPRO countries, corroborating past findings that green space availability is linked with numerous positive outcomes on public health.19,20,24–26 A clear trend emerged, where nations with greater green space availability, such as New Zealand (111.92 m2/person), Australia (79.51 m2/person), and China (75.21 m2/person) exhibited a stronger positive association with healthy ageing. Conversely, countries with lower green space, including Cambodia (44.13 m2/person), Japan (35.33 m2/person), and the Philippines (30.50 m2/person) demonstrated weaker positive impacts. This outcome tends to result from the fact that high-income economies with higher green space per capita have characteristics such as low population densities, extensive natural landscapes, and deliberate government policies prioritising the preservation of green spaces in urban planning.44,48 In contrast, lower-income nations tend to have the smallest green space per capita, likely due to factors such as higher population densities, a lack of urban greening initiatives, and the prioritisation of economic development over environmental sustainability.32,48,49 Interestingly, Japan, a HIC, exhibited relatively limited green space availability, resulting in a weaker positive association with HALE. This may be attributed to its densely populated urban centres and a development approach prioritising compact models over expansive green spaces.50 However, Japan has implemented various policies, such as the Greening Program and the Biotope Network, aimed at enhancing urban greenery, which has led to some gradual improvements over time.33
From our analysis, it is evident that countries like Cambodia and the Philippines may face significant public health challenges due to their limited access to green spaces and relatively high PM2.5 concentrations. These countries often confront the dual pressures of urbanisation and limited resources for environmental management. While resource allocation in LMICs in the WPRO may often involve difficult trade-offs between expanding green spaces and addressing pressing needs like housing and infrastructure development,51 investing in green spaces is a crucial consideration for implementing environmentally sustainable policies. Therefore, we recommend context-specific approaches, such as small-scale, community-managed green spaces, green rooftops, and the integration of green infrastructure into existing urban landscapes, are essential. These strategies can minimise the trade-off with other priorities while maximising the health benefits. Expanding green spaces can deliver other benefits beyond health, such as improving air quality, mitigating urban heat, and managing flood risks. These multi-functional advantages make green space investments more feasible in resource-limited contexts.
When examining the effect of green spaces on HALE at 60 based on the economic classification of countries, the effect was not statistically significant in upper-middle-income countries (p>0.05). This non-significance in UMICs may be attributed to several factors. First, environmental factors such as air pollution, extreme heat, or poor urban planning, can likely undermine the expected health benefits of green spaces. For instance, if green spaces are situated in polluted, high-traffic zones, their capacity to support healthy ageing may be compromised. Additionally, those countries often experience rapid urbanisation which may lead to fragmented or inadequately planned green spaces that fail to provide substantial health benefits.52 In high-income countries, our results showed that the impact of green spaces on HALE became evident at age 76 or earlier and at age 71 or earlier in lower-middle-income countries. The earlier onset of this impact in LMICs suggests that the health benefits of green spaces are more pressing and essential for populations in less economically developed economies, who are more vulnerable to the adverse impacts of environmental degradation and limited access to public green amenities.32,34,49
The regression analysis revealed that past PM2.5 levels significantly contributed to variations in HALE at age 60. The combination of the three lagged variables produced the optimal model, accounting for 92.7% of the variation in HALE. This suggests a robust long-lasting relationship between past air pollution exposure and health outcomes, thus aligning with existing research demonstrating that long-term exposure to air pollution, is associated with various adverse health effects, which can negatively impact life expectancy and overall health status among older adults.5,8,13–16 Compared to the analysis of PM2.5, the regression analysis of the relationship between green space availability and HALE yielded less conclusive results. The Durbin-Watson statistics, ranging from 0.432 to 1.094, indicated significant issues with autocorrelation in the model. These values fall outside the acceptable range, suggesting that the residuals are not independent, and the model’s predictions may not be reliable. The presence of autocorrelation may be attributable to the limited number of data points available for the analysis, which may have impeded the model’s ability to fully capture the impact of green space on HALE. This thus suggests the need for more data across additional years, to improve the validity of the regression model.
From our multivariate analysis, we found that both PM2.5 and green space availability were significantly associated with HALE at age 60, collectively accounting for 85.1% of the variation across the nine WPRO countries examined. Notably, PM2.5 exhibited the strongest effect, explaining 70.3% of the overall variance (η2 = 0.703, P < 0.001), while green space accounted for 21.8% (η2 = 0.218, P < 0.001). This suggests that the potential health benefits of green spaces may be moderated by prevailing pollution levels, indicating that countries with moderate to large green spaces but high PM2.5 concentrations may not fully realise the potential gains in healthy ageing outcomes.
These findings indicate that expanding access to green spaces through policies such as urban forest planting, green space preservation, and urban park development may be an important complementary strategy alongside air pollution control measures to promote healthy and active ageing in the region. Although population density can impact the availability of green spaces, Hong Kong serves as a counter-example. With over 100 urban parks ranging from one to twenty hectares, the city is modernising and maintaining several urban parks, ensuring that they remain accessible to the public.53,54 For LMICs, education and awareness campaigns, alongside international cooperation and financial support may be required to help implement these strategies, as these countries may lack the fiscal capacity to undertake large-scale environmental reforms independently. Such measures could yield significant public health dividends and improve the quality of life for the rapidly ageing populations in the WPRO region.
While this study focuses on urban areas, where air pollution and green space availability tend to be more variable due to rapid urbanisation and infrastructure development, we acknowledge that PM2.5 and green space distribution can differ significantly between urban and rural settings, potentially leading to a distinct impact on HALE. Studies indicate that urban locations typically have higher air pollution levels following traffic congestion, industrialisation, and high population density, increasing the risk of cardiovascular and respiratory diseases.6,7,34,35 Conversely, rural areas especially in low-income settings, generally exhibit lower air pollution levels, but may still face pollution challenges stemming from agricultural burning and reliance on biomass fuels like wood and charcoal for cooking and heating,.55 Regarding green space availability, urban settings often have smaller, more fragmented green spaces, whereas rural areas tend to have larger, but sometimes less accessible natural landscapes.29,52
Study Limitations
This study was limited by the exclusion of certain countries classified under the WPRO, such as Palau, Marshall Islands, Niue, Nauru, Tuvalu, and Cook Islands, due to the unavailability of data on Health Adjusted Life Expectancy at age 60 for these nations. In addition to these countries, Brunei, Singapore, Fiji, Tonga, Kiribati, Laos, Micronesia, Mongolia, Papua New Guinea, Samoa, Solomon Islands, and Vanuatu were excluded in the Green space metrics due to the non-availability of data. The exclusion of certain countries in the WPRO due to data limitations may introduce bias and limit the generalisability of the findings to the broader region. These gaps in the analysis could constrain the ability to fully capture the diversity of health outcomes across all WPRO countries. Consequently, the results should be interpreted with appropriate caution. Future research would benefit from expanding the analysis to include the previously excluded nations as relevant data becomes available, thus enhancing the comprehensiveness of the investigation.
Additionally, the cross-sectional nature of the data used in this study limited our ability to infer causal relationships between PM2.5, green space per capita, and HALE. Therefore, readers should exercise caution when interpreting the findings as indicative of associations rather than definitive causal relationships among the examined variables. To establish stronger evidence of causality, future research should adopt longitudinal designs that track changes in these environmental factors and health outcomes over time. Cohort studies that observe the long-term health effects of populations exposed to varying levels of green space and air pollution would provide deeper insights into these complex relationships.
Another limitation of our study is the use of national-level averages for PM2.5 concentrations and green space availability, which was necessary given the scope and data constraints. This macro-level perspective may not fully capture the within-country variations, especially in geographically diverse countries. We recommend that future research incorporate subnational data, where available, to enable a more nuanced analysis of the relationships between environmental factors and healthy ageing in geographically heterogeneous countries. Similarly, given that this study did not provide any direct urban-rural comparison, future studies should examine the differential impacts of these environmental factors on HALE between urban and rural settings. Such an approach will yield a more holistic understanding of how the built and natural environment influences HALE.
Furthermore, our analysis focused solely on environmental factors (PM2.5 particulate concentration and Green area per capita) without accounting for other demographic and socioeconomic factors that may moderate or confound the relationship between environmental factors and HALE. Future studies should consider incorporating those factors to provide a more comprehensive understanding of the complex interplay between various factors in shaping healthy ageing outcomes in the WPRO. Finally, our use of ANOVA constrained our ability to model continuous predictors of PM2.5, green space per capita, and HALE at age 60. Future studies could apply advanced regression techniques to better elucidate the complex interplay between environmental determinants and health outcomes.
CONCLUSIONS
Given the cross-sectional nature of this study, our findings should be interpreted as preliminary associations, rather than definitive causal effects. While our analysis suggests that green space availability may mitigate some negative impacts of air pollution, the long-term benefits and potential interactions between these environmental factors warrant further investigation. Nevertheless, more ambitious air pollution control policies are necessary across WPRO countries, to improve healthy ageing outcomes and meet the WHO’s recommended air quality guidelines. Simultaneously, increasing access to green spaces through urban planning and environmental preservation appears to be an important complementary strategy for promoting healthy ageing. While all countries require action, income-specific strategies are critical for countries in this region. Hence, in HICs, where baseline air quality and green space availability are already higher, policies should prioritise improving the quality and accessibility of green spaces. Also, strengthening regulations to further reduce PM2.5 emissions in urban-industrial areas is critical. For UMICs, policymakers should prioritise cost-effective green infrastructure solutions and stricter air quality regulations to mitigate the health impacts of urbanisation. Public-private partnerships could facilitate the financial and logistical aspects of such projects. In lower-middle-income countries, integrating green spaces into broader urban planning initiatives using specific approaches that fit contexts can simultaneously address issues such as flooding and urban heat. Additionally, education and awareness campaigns should complement international funding to support sustainable urban development. Achieving healthy ageing in the WPRO region will necessitate a multi-faceted, collaborative approach that addresses both air quality and access to green spaces, especially for vulnerable populations. This approach ensures that the health benefits of environmental factors can be equitably distributed as populations rapidly age across the region.
Acknowledgement
The authors extend their gratitude to Dr. Fen Liu of the Centre of Evidence-based Practice for Health Care Policy, School of Nursing, Hong Kong Polytechnic University for her invaluable insight and advice on statistical methods
Ethics statement
Ethical approval was not required for this study.
Data availability
The data used in this analysis are available from the corresponding author upon reasonable request.
Funding
The research presented in the manuscript received no external funding.
Authorship contributions
All authors were involved in developing the study design, interpreting the data, and providing critical feedback on the manuscript. JM conceptualised the study, SS conducted the data analyses, and JE drafted the initial manuscript. The entire author team contributed to the writing and revision process, and they collectively held the final responsibility for submitting the work for publication.
Disclosure of interest
The authors completed the ICMJE Disclosure of Interest Form (available upon request from the corresponding author) and disclose no relevant interests.
Correspondence to:
Jed Ray Montayre, PhD
School of Nursing, The Hong Kong Polytechnic University
11 Yuk Choi Road, Hung Hom
Hong Kong
jed-ray.montayre@polyu.edu.hk
Juliet Chigozie Donatus Ezulike, PhD
School of Nursing, The Hong Kong Polytechnic University
11 Yuk Choi Road, Hung Hom
Hong Kong
juliet-cd.ezulike@polyu.edu.hk