INTRODUCTION
Demographic, sociocultural and economic transitions are driving the increased risk and prevalence of diabetes and other non-communicable diseases.1 In 2022, 43% of adults aged 18 years and over were overweight and 16% were living with obesity.2,3
Eating habits are defined in terms of a recurring choice that a person, or a group of people, make about the foods they eat, how often they eat them, and how much they eat each time.4 An estimated 80 to 90% of people with type 2 diabetes are overweight or obese.5 Lifestyle habits – including the foods and beverages you consume and how active you are in your daily life – can also affect your weight. If you take in more calories from food or beverages than you use during physical activity and through daily living, such as doing housework or walking to the store, your body may store some of these extra calories as fat.6
Approximately 197 million people worldwide suffer from impaired glucose tolerance, most commonly due to obesity and associated metabolic syndrome. This number is expected to reach 420 million by 2025.7 Even if the epidemiological situation of diabetes in the DRC remains poorly understood, the estimate prevalence of diabetes is of 7%.8 According to Dr. Diablelolo, a DRC official at the National Program against diabetes, the prevalence in the city varies from 5% to 7% of the population, while in rural areas, there is little reliable data, such as in Kisantu, a semi-urban area, located in the province of Kongo Central, where the prevalence is 4.7%.9
Figures from the IDF Diabetes Atlas10 show that in 2021, 537 million adults (20-79 years) were living with diabetes, three quarters of whom were in low-income countries. In that year, 6.7 million people died from diabetes, that is to say, one person died every five seconds. That same year, diabetes-related spending was estimated at US$ 966 billion. In 2014, 8.5% of adults aged 18 years and older had diabetes.11 Household size and expenditures influence the number of meals and consumption of basic meals12. In addition, Africa is facing a growing problem of overweight, according to WHO. It is stated that the prevalence of adult obesity is expected to increase from 13.6% to 31% in the ten most affected African countries by 2023.13 In reality, several studies have been conducted in the DRC on eating habits,14–17 but the relationship between the people’s eating habits in Kinshasa and their glycemic and nutritional status remains not sufficiently explored by many studies to date. A study conducted among 346 households in three neighborhoods of Kinshasa selected based on income levels revealed significant differences in the food consumption habits. According to this study, the staple foods consumed in the three study sites were fufu (cassava porridge mixed or not with corn flour).18 The eating habits of the population of Kinshasa (the Kinois) are linked to social, economic and cultural identities. A study on associations of the glycemic index and the glycemic load with risk of type 2 diabetes in 127 594 people from 20 countries (PURE), a prospective cohort study, showed that diets with a high glycemic index and a high glycemic load were associated with a higher risk of incident type 2 diabetes in a multinational cohort spanning five continents.19
Studies looked at these characteristics separately and essentially out of the DRC, some of them finding that T2D risk may differ by the age of onset and duration of excess body weight, and the type of weight loss intervention and that a better understanding of the changes in weight is needed, but related correlates of T2D risk that evolve contemporaneously over time has important implications for designing and targeting primary prevention efforts.20 In this study, we sought to identify the association between food consumption and risk of type 2 diabetes and overweight/obesity among adults in Kinshasa, Democratic Republic of Congo (DRC). We hypothesized that the eating habits of the population of Kinshasa are likely to represent risks on the nutritional status and glycemic status of consumers, these two parameters being in turn in correlation.
METHODS
This is a cross-sectional study with analytical purposes carried out among adult population residing in the City of Kinshasa. The study site that was selected is the Lingwala Health Zone (in the DRC, Health Zone is the equivalent to Health District), one of the 35 Health Zones in this capital city. The target population consisted of anyone residing in the Lingwala Health Zone. The statistical unit is an adult individual (age ≥18 years) consenting to participate.
To select the sample and its size, we used a four-stage probability sampling technique. In the first stage, we chose the Lingwala Health Zone, then at the second stage, from the sampling frame of 8 health areas (a Health Area is a subset of a Health Zones), 50% of the health areas (4) were drawn using a simple random sampling technique, comprising La Voix du peuple Health Area, Pakadjuma Health Area, 30 juin Health Area and Lokole Health Area. At the third stage, we randomly chose a number of households per street proportionally to the population size of each Health Area. The sample size was drawn from this population, based on the prevalence of type 2 diabetes in Kinshasa estimated at 12.1%,21 with a confidence coefficient of 1.96 and a degree of precision of 95%, based on the following formula:
n≥Z2∝PQd2 or n≥Z2∝P(1−P)d2
Where
Z : confidence coefficient = 1.96
n: Sample size
p: assumed proportion of the target population having the characteristic studied (having diabetes mellitus), as the prevalence of Lingwala is not known, we used that found in the study done by Kasiam et al in 2005 in Kinshasa with a prevalence of 12.1%. So p = 0.121.
q: assumed masked proportion of the population = 1-p=1-0.121 = 0.879
d: the desired degree of precision of 95% (i.e. d= 0.05)
This gives: n ≥= 163 participants
In order to minimize bias, the sample size was increased by 10%, to compensate for expected dropout, incomplete records, and other study-related problems, to ensure that even if some respondents drop out or do not complete the survey, the final sample size remains sufficient to maintain the study’s validity and reliability, which gave a total number of 182 subjects. These were selected proportionally to the size of each Health Area: 25 from La Voix du peuple Health Area (9 776 people), 63 from Pakadjuma Health Area (27 130 people), 60 from 30 juin Health Zone (25 070) and 34 from Lokole Health Area (14477), whereas the total population of Lingwala Health Zone is 76 453.
Before data collection, the research protocol was given approval by the ethics committee of the Kinshasa School of Public Health and was pilot-tested. In compliance with ethical rules, respondents were taken after oral free and informed consent after a brief explanation of the aim of the study. The data was collected from May 22 to 27, 2023. Blood samples were taken from households. Casual blood sugar levels were measured using a Safe AQ brand electronic glucose meter and interpreted instantly. The data were collected through a semi structured questionnaire, processed and analyzed using SPSS version 21 software, with the use of the following descriptive statistics such as means, median and khi2. Likewise, the data was analyzed anonymously to preserve the human dignity of respondents.
This study had some limitations, including memory bias: the probability of remembering food consumption from a week ago depends on several factors such as age, gender, mental health, sleep quality, stress, quantity and quality of food consumed, and meal frequency. To reduce recall bias, we used the method of repeatability consisting of assessing repeatability to ensure consistency over time.
To enable respondents to recall meals consumed seven days before the survey, we had a list of foods. Despite this, this study has the merit of having been well conducted to counterbalance or circumvent this double weakness. On the one hand, multi-stage probability sampling was rigorously applied and on the other hand, the calculated study sample was increased to cancel out the effects of sampling bias. We increased the sample size by 10%, which gave a total of 182 subjects.
RESULTS
Sample characteristics
Age, sex, marital status, level of education, household size and food expenditure, concerning the respondents, are described in Table 1.
Table 1 above indicates that the sampled people present the following socio-demographic characteristics: more women (62.1%) than men; more people in a marriage or union (46.2%); more than one in two people (54.4%) have at least completed secondary education: one in five (20.9%) with an incomplete secondary education level and one in three respondents (33.5%) with a completed secondary school.
Anthropometric and blood sugar measurements
Median and limits of anthropometric and glycemic measurements were computed as shown in the Table 2.
The median blood glucose is 99.5 mg/dl (68-407), while the median body mass index is 26.5 kg/m² (14.6-44.3) based on a mean height of 161 cm (137-191) and a mean weight of 70 kg (42-150).
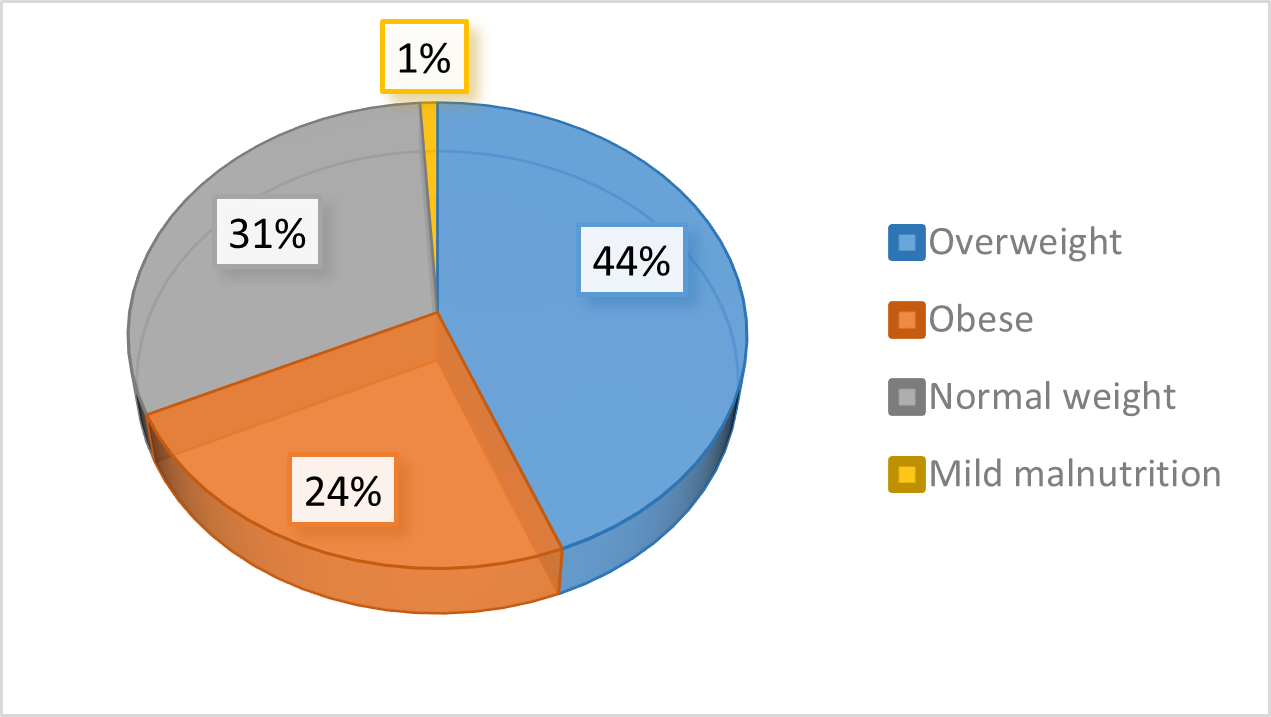
Following the WHO 2019 formula,20 the nutritional status of the respondents was calculated. The respondents were divided according to the nutritional type in malnutrition as follows: normal weight, overweight and obese (Figure 1).
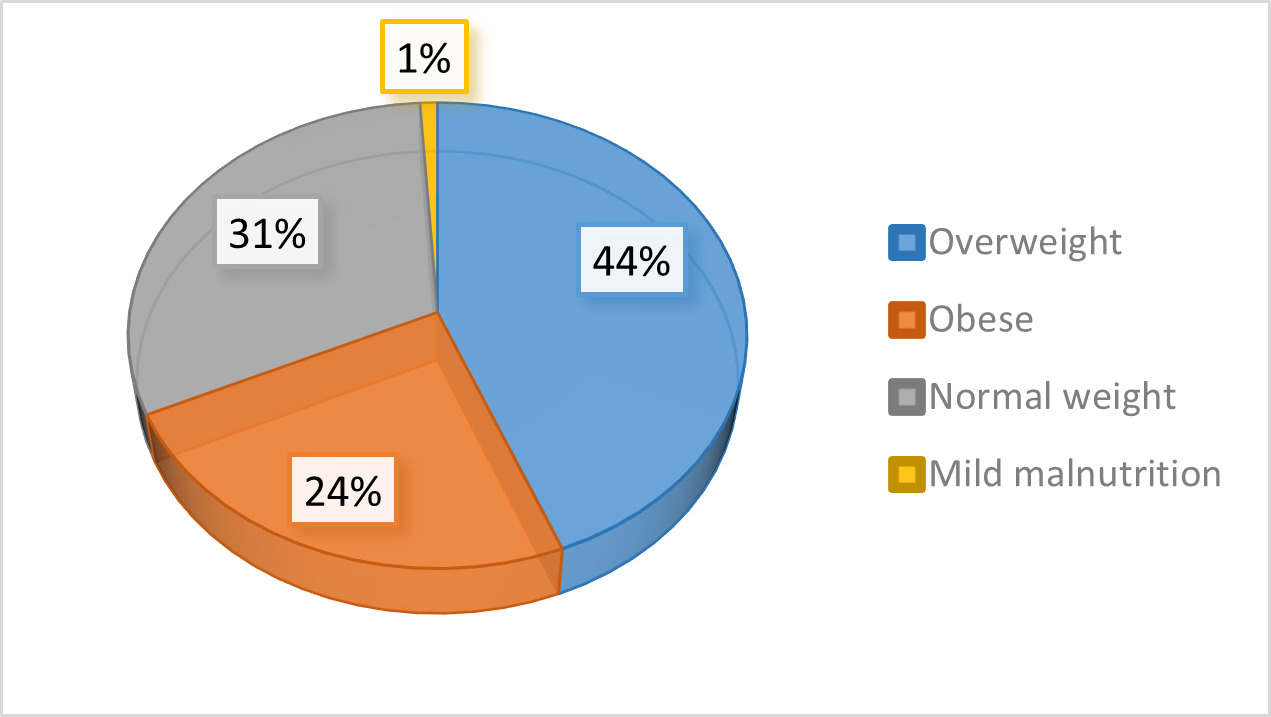
According to their nutritional status, it appears that 44.4% of respondents were overweight, 24.4% were obese and only 1% had mild malnutrition (Figure 1).
Blood sugar status was assessed to see its association with weight status as show below, whereas blood sugar status was considered as normal or hyperglycemia and weight status was considered as without overweight and with overweight. Table 3 below describes data about this.
It appears that 68.6% of respondents had a weight problem, of which 44.4% were overweight and 24.1% were obese. In addition, 23.6% of participants had hyperglycemia, among them 8.8% had hyperglycemia and were obese, i.e. 37.3%. In addition, 6% had hyperglycemia and were obese and 2.7% had hypoglycemia but had a weight problem.
Aspects of respondents’ food consumption in general
Several eating behaviours and habits were inquired about, and participants described how they usually eat. Table 4 shows the association between the respondents’ behaviors and their glycemic status.
According to food consumption habits, the majority of respondents usually eat once a day (77.5%, CI 95%) out of 182 respondents (this including main meal with cereals and meat) and 61.53% against 10.1% who eat more than three times. Other habits include people who prepare food alone (61.5% CI 95%), those who eat alone (54.4% CI 95%), and very few of those who read the labels of the products purchased (14.8% CI 95%).
Food consumption and glycemic response
Here, eating habits are cross-tabulated with blood sugar levels taken from the respondents to see the relationship between these two variables. Table 5 describes the results of this analysis.
Among the respondents who presented glycemic problems, 96.7% consumed in the last 24 hours, oils, sugar and sweet products (92.9% CI 95%) as well as milk and its derivatives (85.2% CI 95%). They are followed by those who consumed meat and fish, pulses and also cereals and tubers, representing respectively 95% and 96.7%. Those who consumed fruits represent 82.4%. But none of these was significantly associated with glycemic status.
DISCUSSION
We aimed at determining the association between eating habits, weight status and glycemic status. Overall, 23.2% of the respondents experienced hyperglycemia, 8.3% being not overweight. This is a high prevalence compared to the global prevalence of 8.5% for adults aged 18 and over for 201422 and a prevalence of 7% in the Democratic Republic of Congo.23
Sociodemographic characteristics
There was a sample of females (62.1%) and married people or in union situation (46.2%). Among factors described to be leading to gender disparities during data collection, studies include divergent customs, whereas women are normally homebound in some cultures,20 such as in many communities in Kinshasa. Many men go out very early in the morning in search of something to feed the family, others go for work or for study while women mainly stay home to put the house in order. Data was collected in the morning when most the men were already out. This is in accordance with the findings from study done by Lahreche Ikram24 who found that women are easily met at home when surveys are being conducted.
More than one in two people (54.4%) had at least secondary education: one in five respondents (20.9%) with less than secondary education and one in three (33.5%) with completed secondary school. Only 19% of respondents have been to university or higher education institute. This is confirms results of studies from systematic literature review and meta-analyses that found an association between a lower education and total and central obesity.25
Nutritional status
There were 44.4% of respondents with overweight and 24.4% with obesity. This rate shows that people in Lingwala have high problem of body weight (68.8% of them), higher than the rate found by Okunogbe A et al.26 with 43% overweight and 16% with obesity. This is far different from the national obesity prevalence is 7% (WHO, 2023). In addition, 23.6% of participants had hyperglycemia. In addition, 6% who had hyperglycemia, were obese and 2.7% who had hypoglycemia but had a weight problem.
Eating habits and overweight and hyperglycemia
Data also showed that the majority of respondents usually eat once a day (77.5%) only 10.1% eat more than three times. Other eating habits included habits eating alone (91.8%), in the car (96.2%), feeling like eating quickly (95.1%), eating under stress (96.7%)), eating while doing other activities (92.9), etc. Only one habit was significantly associated with hyperglycemia: reading the labels of the products purchased (85.2%), p<0.05. The highest proportion (39.9%) had difficulty in understanding the content of the nutrition labels.27
Despite the presence of glycemic problems, and the consumption of oils (96.7%) sugar and sweet products (92.9%) as well as milk and its derivatives (85.2%), and fish meat and fish, pulses, cereals and tubers, representing respectively 95% and 96.7% etc., none of these was significantly associated with glycemic status. This is not in line with findings on Associations of the glycemic index and the glycemic load with risk of type 2 diabetes in 127 594 people from 20 countries (PURE): a prospective cohort study that showed that diets with a high glycemic index and a high glycemic load were associated with a higher risk of incident type 2 diabetes in a multinational cohort spanning five continents.28
Conclusions
In this study, we sought to identify the association between food consumption and risk of type 2 diabetes and overweight/obesity among adults in Kinshasa, Democratic Republic of Congo. We hypothesized that the eating habits of the population of Kinshasa are likely to represent risks on the nutritional status and glycemic status of consumers, these two parameters being in turn in correlation. We conducted a multistage probability sampling of and selected 182 adult individuals living in the Lingwala Health Zone, in the Democratic Republic of the Congo. The survey was based on biological samples (blood sugar) and anthropometric measurements (weight status). There were 68.8% respondents with high weight trouble (44.4% overweight and 24.0% obese). Up to 14.8% respondents were both overweight and hyperglycemic; with more women (62.1%); more people in marriage or union (46.2%). We recommend that stakeholders, including MoH, community, and civil society need to partner in raising awareness for changing behavior and eating habits (eating whole grains, fruits, vegetables with high fiber, eating small, and regularly, cooking while consulting dietitian where necessary) and integrating care services at community level for screening of nutritional problems and dietary advice. Further research, particularly longitudinal studies is needed to better explore causal relationships between eating habits, weight status, and glycemic control.