


INTRODUCTION
Kinshasa, the capital of the Democratic Republic of Congo (DRC), has a population of over 11 million people, as reported by the District Health Information System 2 (DHIS2) in 2022. This population is unevenly distributed, with many residents needing to travel long distances to reach healthcare facilities, which complicates rapid access to healthcare services.1
Since the 1980s, the DRC has seen a significant shift toward private-sector involvement in healthcare, driven by the structural adjustment policies advocated by the Bretton Woods Institutions. This shift has led to a notable increase in private healthcare providers, aimed in part at enhancing geographical access to healthcare services.2 The private healthcare sector now plays a crucial role in the country’s health system, as highlighted in the National Health Development Plan (PNDS) 2024-2033. The DRC’s Ministry of Public Health has called on its development partners to explore strategies for engaging the private sector more effectively to improve health outcomes and achieve the goal of universal health coverage.3,4
Despite the importance of the private healthcare sector, there have been no comprehensive studies examining the factors that influence the local development of entrepreneurship in the health sector in the DRC, particularly in Kinshasa. This study aims to address this gap by investigating the relationship between the profile of the health zone and the development of private healthcare provision. Specifically, it seeks to answer the following questions: What is the relationship between the health zone profile and the growth of private health service providers? What factors drive medical entrepreneurship within an urban health zone? Based on field observations, the main hypothesis of this study is that the profile of the health zone significantly influences the development of private healthcare services.3
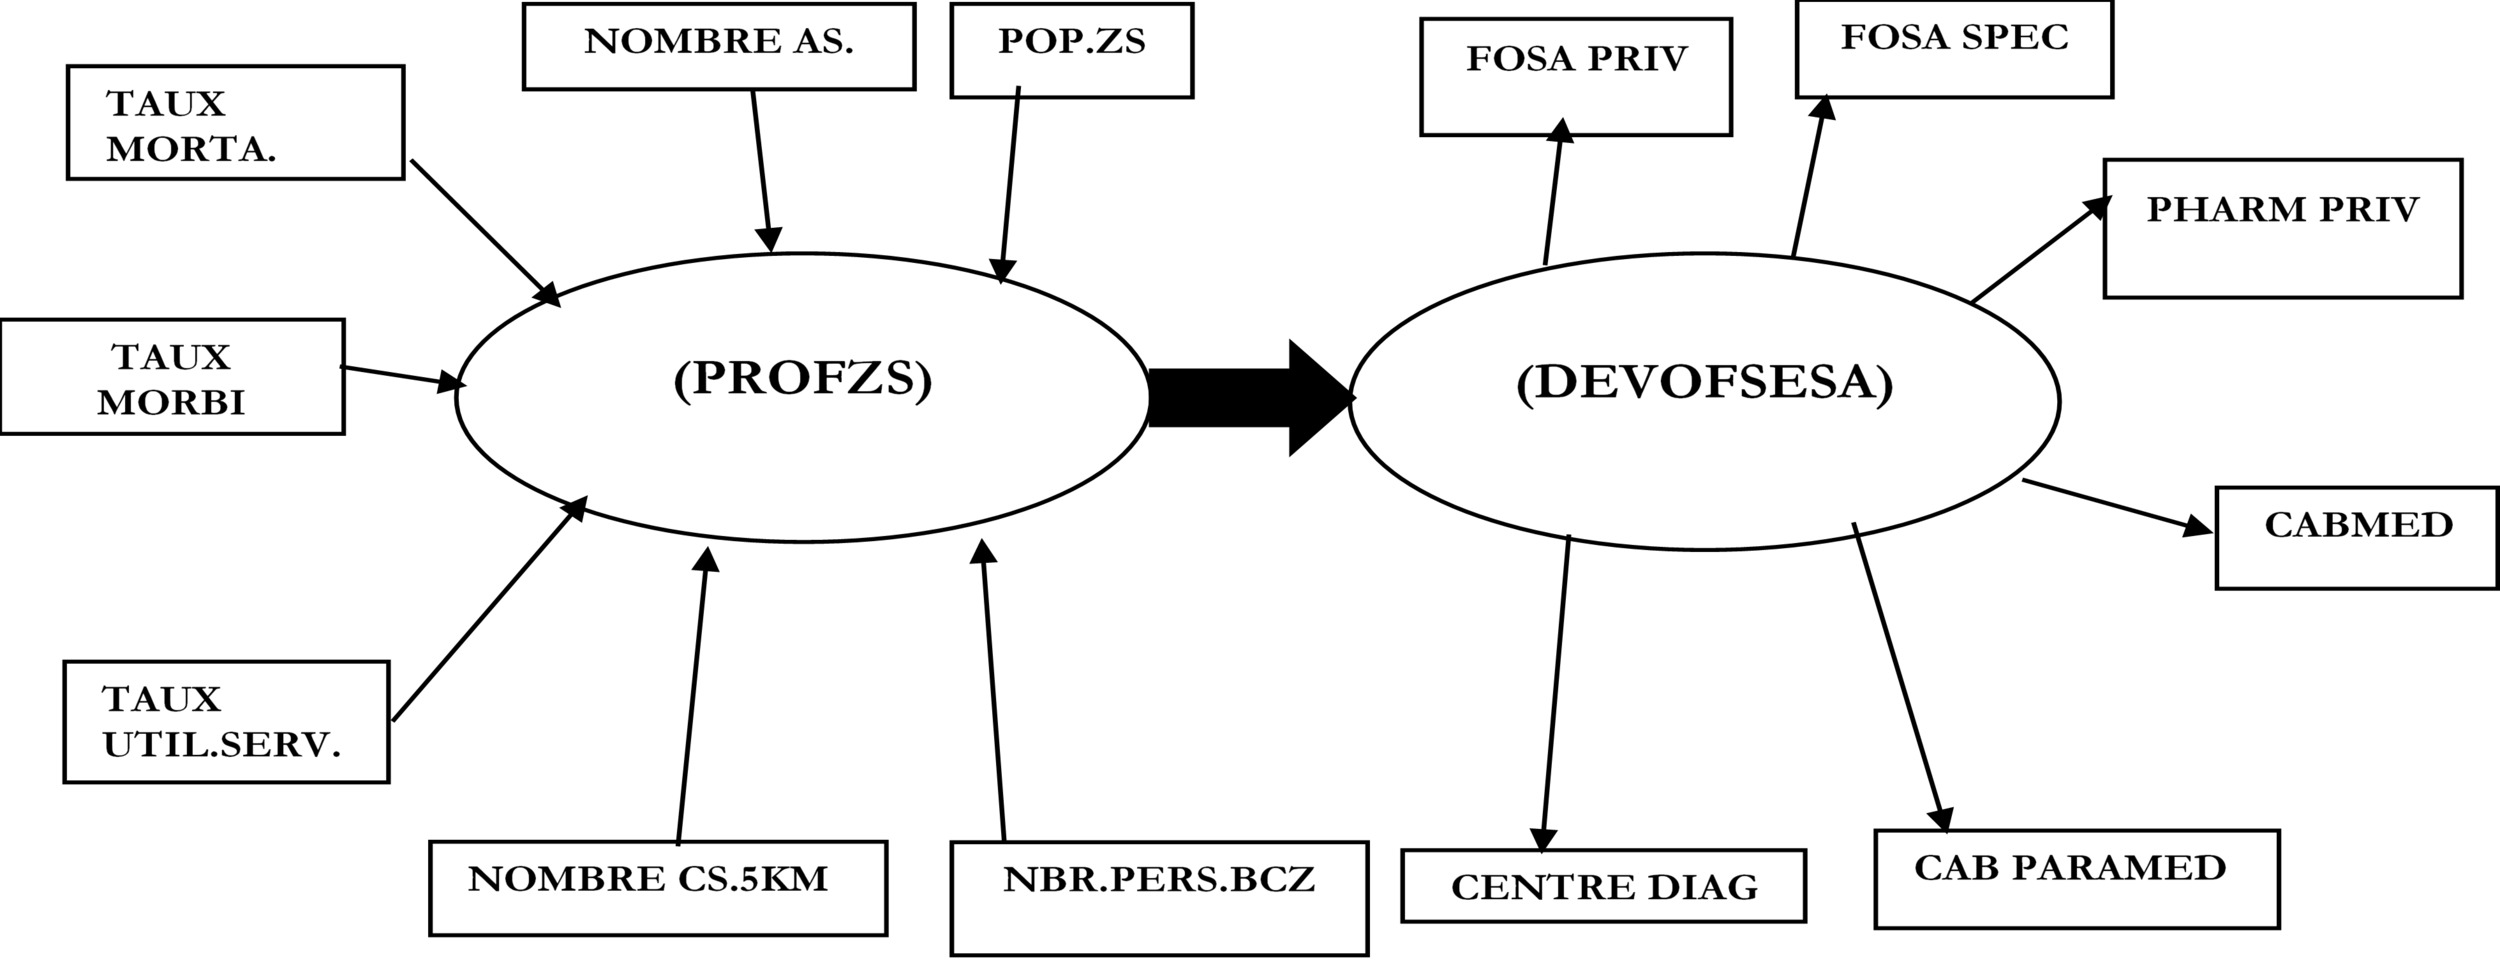
The study also posits additional hypotheses: The health zone’s profile is shaped by factors such as its population, number of health areas, mortality rate, morbidity rate, proximity of health centers within 5 km, service utilization rate, and the number of qualified staff in the central health zone office (BCZS). On the other hand, the development of private healthcare provision is characterized by the number of private health facilities, specialized health institutions, private pharmacies, medical and paramedical practices, and diagnostic centers.1,2
The objective of this study is to measure the correlation between the health zone profile (ZS) and the expansion of private healthcare services by category. Specifically, it aims to assess the influence of the health zone profile on the development of private healthcare provision by category.2
Private healthcare provision is a growing phenomenon in Africa and other regions. For instance, in Senegal, private healthcare providers are significant contributors to the healthcare system, delivering nearly 22% of contraceptive services. The sector comprises a diverse mix of providers, including non-profits, faith-based organizations, and for-profit entities, ranging from large hospitals to small clinics.3
According to Pellet et al., private healthcare providers offer a range of preventive and curative services, and workplace healthcare initiatives are an example of private sector involvement in expanding access to health services.5 However, IBON notes that privatization often leads to rising healthcare costs, as resources are shifted from the public to the private sector. This trend can result in skilled healthcare workers being drawn away from the public sector due to better compensation and working conditions offered by private entities.6,7
The Philippine Department of Health reports that 60% of the country’s hospitals are privately owned, while the World Health Organization (WHO) estimates that only 30% of the population can afford these private healthcare services. Furthermore, the overall cost of care in private facilities, including transport and treatment, can be up to five times higher than in public facilities [6].
In Mali, the private healthcare sector is characterized by uneven distribution, limiting its market reach and sometimes resulting in reduced quality of care. The sector’s weak integration with public health initiatives also poses challenges to its alignment with national health objectives. Furthermore, private providers in Mali face barriers such as inadequate funding, limited support for setting up facilities, and insufficient training opportunities.7
Given the evolving role of private healthcare provision in Africa, it is essential to examine local-level factors influencing its development. Based on the findings from previous studies and empirical observations, this study proposes a research model outlined in Figure 1.
METHODS
Study type
The study took place in Kinshasa from 15 May to 16 July 2023. In terms of period, this study is cross-sectional: the data covers the period from 1er April to 31 May 2023. In terms of objective, the approach used is quantitative (econometric method), more specifically by means of the Partial Least Square -Partial Modelling (PLS-PM) algorithm. From this point of view, the study aims to assess the causal relationship between the two main variables. The advantage of this algorithm is that it makes it possible to measure relationships between variables which, like those chosen in this study, are latent.
Study population and statistical units
The statistical units in this study are the health zone, on the one hand, and the private health care and service provider, on the other. The study population is made up of all 35 health zones, on the one hand, and all private health care and service providers in the city of Kinshasa, on the other. For the health zones, all 35 health zones in the city of Kinshasa are included. In addition, to be included in an HZ, a person must be a private health care and service provider listed by the Kinshasa Provincial Health Division (DPS) during the year 2022. Any private health care provider not listed by the Kinshasa DPS for 2022, any private faith-based provider and any other not-for-profit provider are excluded from the study sample. The exhaustive sampling technique was applied to select the health zones and private for-profit. health care and service providers listed by the DPS-Kinshasa in 2022 (Figure 2).

Data
The documentary technique was used to collect the data. A review of the documentation available at the DPS of the city of Kinshasa for the year 2022 was carried out. The choice of period was dictated by the availability of data relating to the variables selected. All the data for the indicators (see Table 1) were taken from the DPS database for Kinshasa 2022. The data were collected using the tablets and then imported into Microsoft Excel to form a database, before being imported into Addinsoft’s XLSTAT software, version 2019.3.2.61685, which served as the numerical implementation of the PLS model. Given that the various manifest variables are diversified in their measurement, to obtain compatible scales as required by the PLS-PM technique
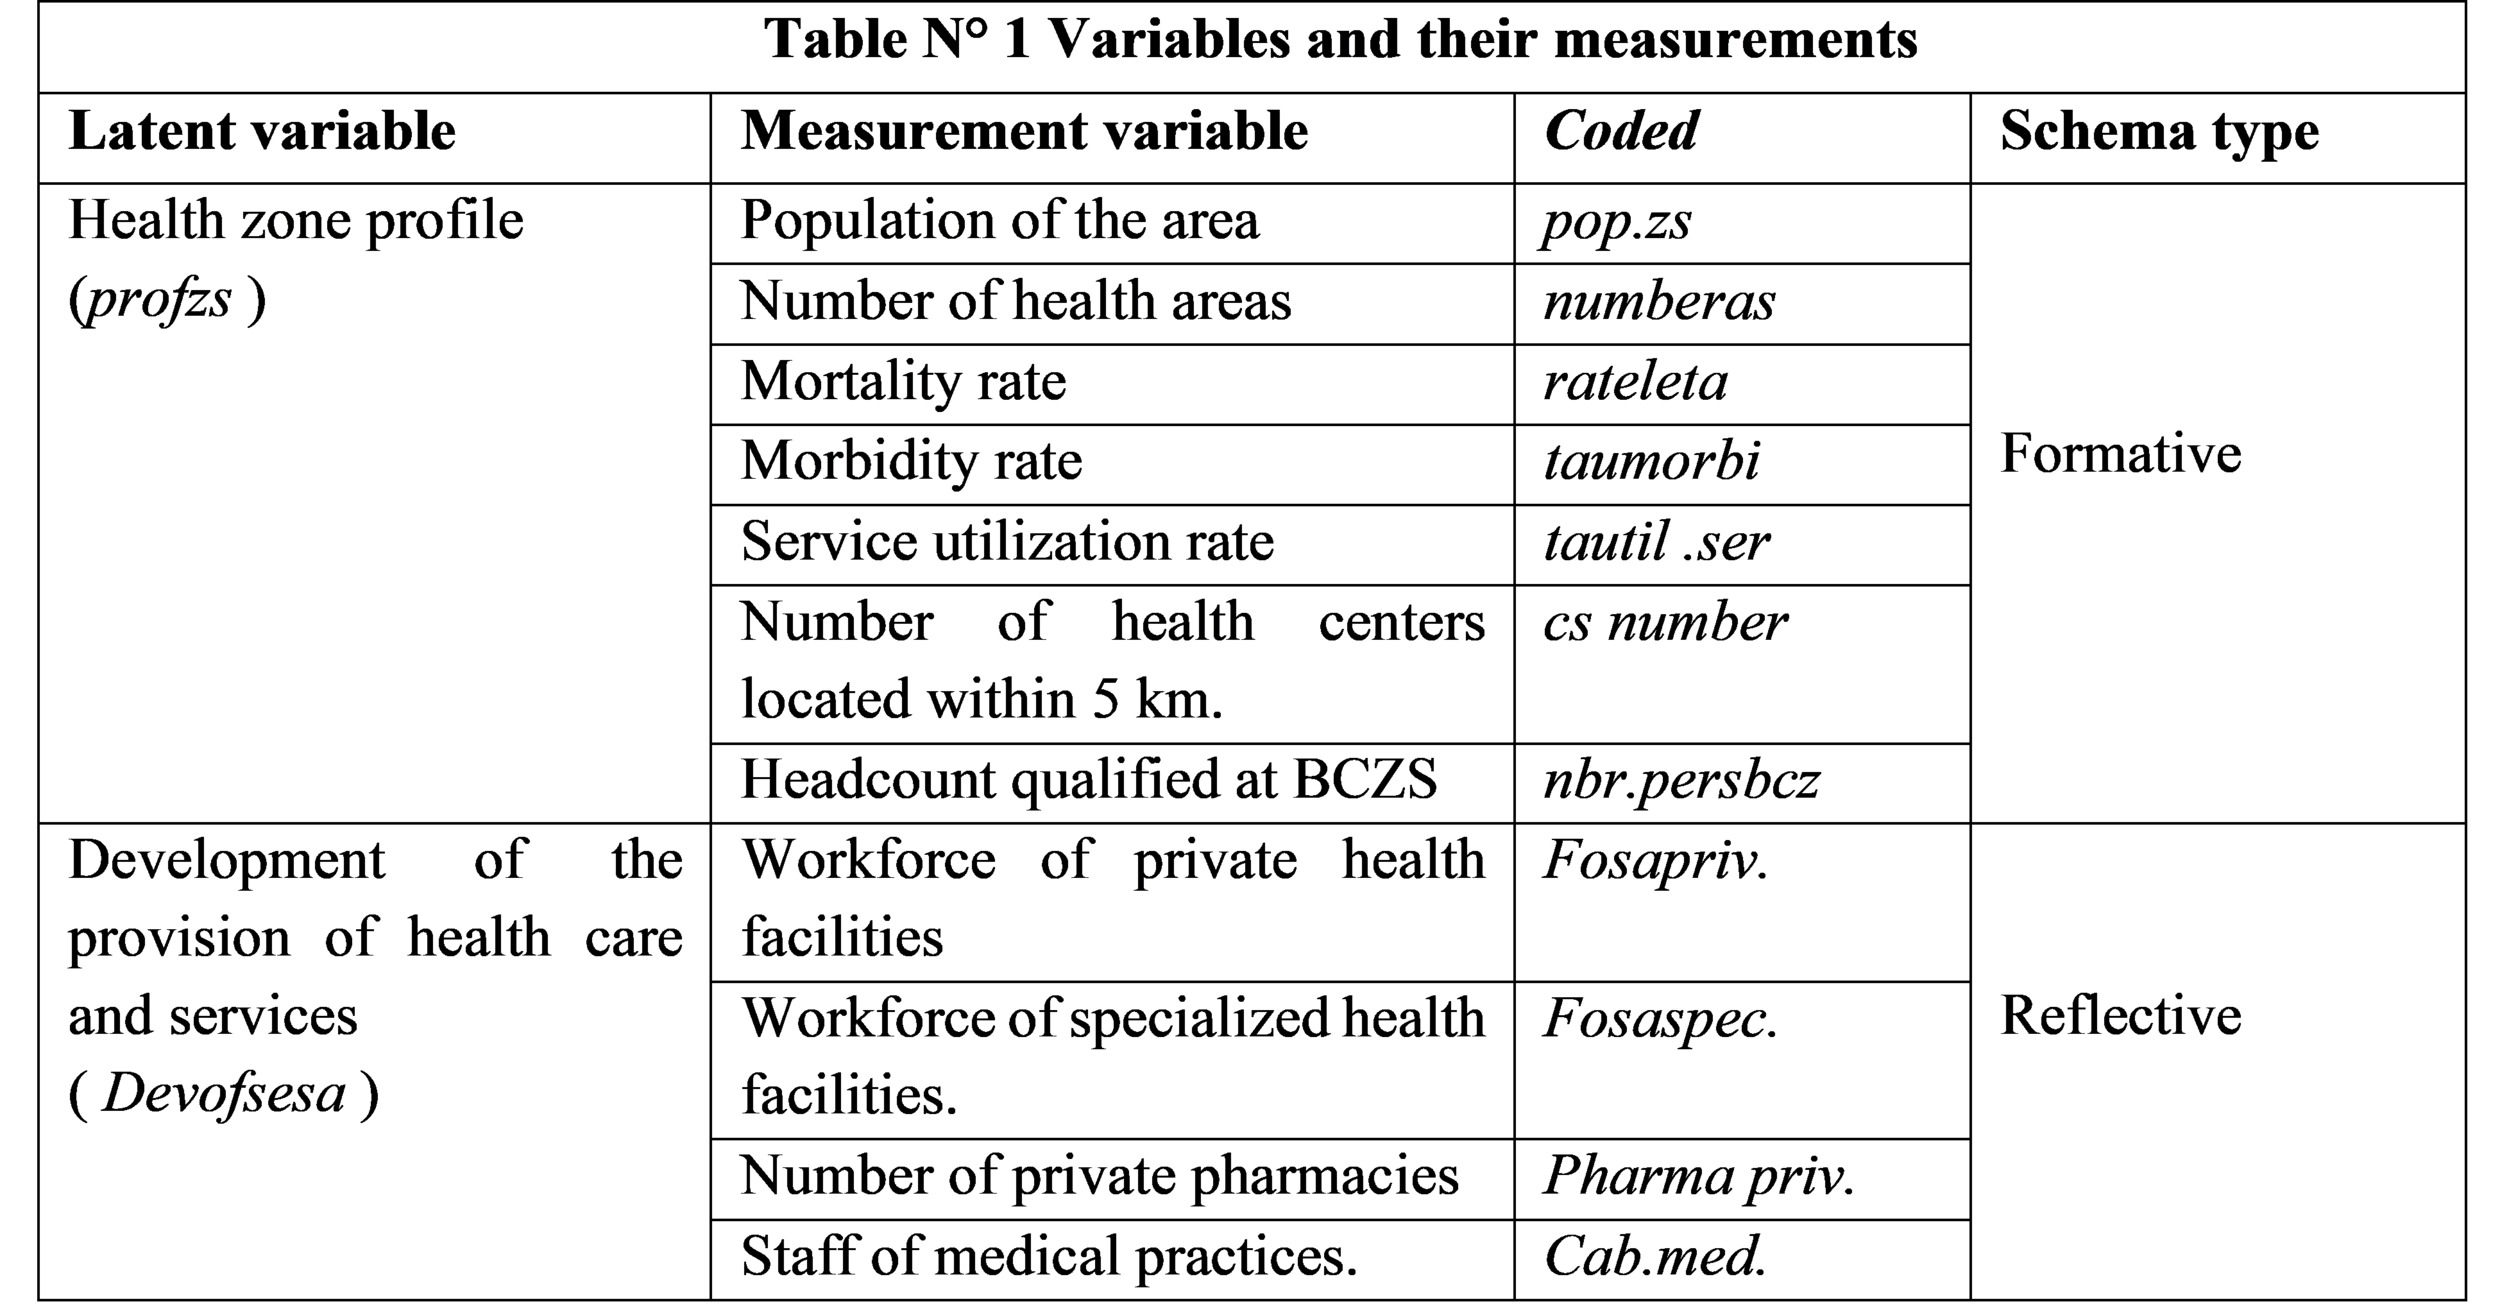
Variables and their measurements
According to the objective of this study, the study variables are the profile of the health zone and the development of health entrepreneurship. Obviously, the two variables are non-quantifiable and therefore called latent. To measure them, several indicators
Analysis approach
Stages of the approach
The PLS-PM algorithm, which is a multivariate approach, was used to analyse the data.

Model specification
With reference to (Figure 1), a system of structural equations was developed from the variables selected for the study and their indicators. As a reminder, structural equation models (SEMs) are statistical analysis models used to study the multiple causal links between a set of latent variables (LVs) representing a concept or construct that is not directly observable and requires a set of indicators to be measured.8 Known as manifest variables (VMs) in MESs, these indicators are variables for which a measurement can be directly collected [9]. MES are represented by a path diagram, in which the variables (latent variables) are represented by a spherical shape and their indicators (manifest variables) by a rectangle (fig.4). According to Zheng, Plaisent and Zuccaro, a structural model with latent variables is a graphical model and serves to resolve the difficulty of transposing all the structural relationships into algebraic form.9
-
Each manifest variable is linked to a single latent variable, while latent variables can be linked to several manifest and latent variables. In the oriented graph, the arrows linking the latent variables demonstrate the causal relationships that are verified by the model. Given this clear distinction between types of variables and their relationships, an ESM is always defined by two sub-models.8
-
The first (measurement or external model) considers only the relationships between the manifest variables and their latent variables, while the second (structural or internal model) concerns the relationships between the latent variables themselves. The distinction between the two sub-models is necessary because the specification of the external model is mandatory before assessing the significance of the internal model [9].
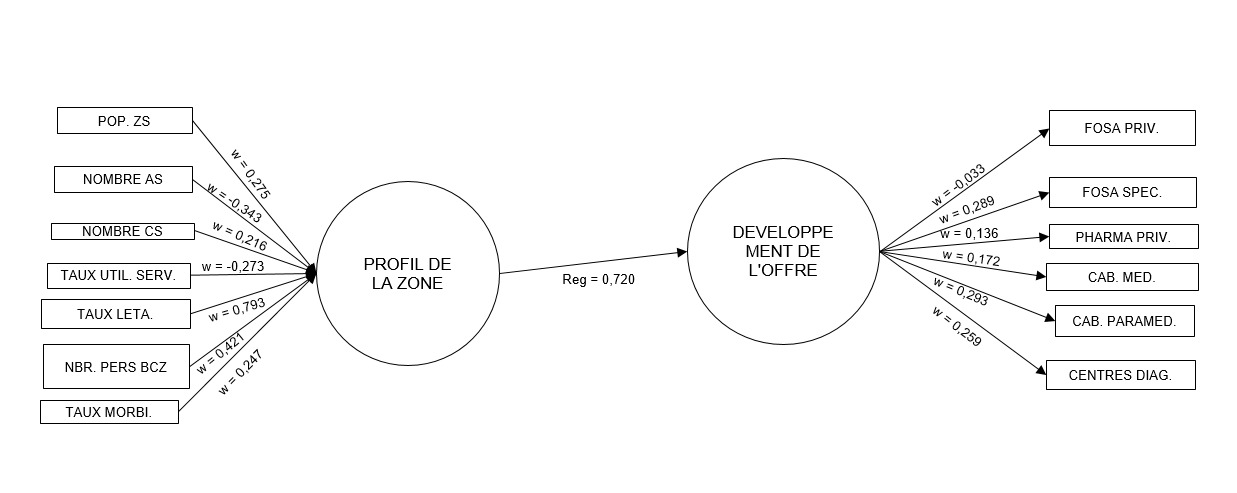
The formulation of the model began with a double specification: that of the structural model and that of the measurement model. For the structural model, the relationships between the analysis variables presented below are established on the basis of the following hypothesis: the profile of the health zone has an influence on the development of the supply of health services and care. For the measurement model, the relationships between the variables and their indicators are based on the following two assumptions: firstly, the population of the health zone, the number of HCs, the number of CSs, the number of qualified HZCO staff, the case-fatality rate, the morbidity rate and the rate of use of services together describe or, ultimately, determine the profile of a health zone; secondly, the number of private health facilities, the number of specialised private health facilities, the number of private pharmacies, the number of doctors’ surgeries, the number of paramedical surgeries and the number of diagnostic centres each reflect the development of private provision of health services and care.
These hypotheses clearly induce the relational patterns of the causal model between the latent variables and their measurement indicators. For the profile of the health zone, the relational pattern is formative, while it is reflexive for the development of private provision of health care and services. As a reminder, in a causal model, three types of relationship between the latent variable and its indicators are possible depending on whether the indicators are reflexive, formative or both: the reflexive or reflective scheme, the formative scheme and the mixed scheme. In the reflexive[8,9,10], mode, the indicators are created with a view to measuring all the same underlying phenomena. Each manifest variable reflects its latent variable and is linked to it by a simple regression (systems of equations 3 and 4): the latent variable exists in theory but is unobservable. It influences the indicators and explains their inter-correlations. Reflexive indicators must be internally consistent.10
Furthermore, in the reflexive mode, the sense of causality runs from the measurement variables to the latent variable and “the indicators, as a group, jointly determine the conceptual and empirical meaning of the construct”. The reflective schema is the schema typically used in MES and its aim is to minimise the residual variance in the external model. In this scheme, the indicators depend on the construct and are considered as measures of the latent variable or as quantified elements of the theoretical concept. The latent variable is then a simple construct whose indicators each represent a dimension [9] (Figure 4).
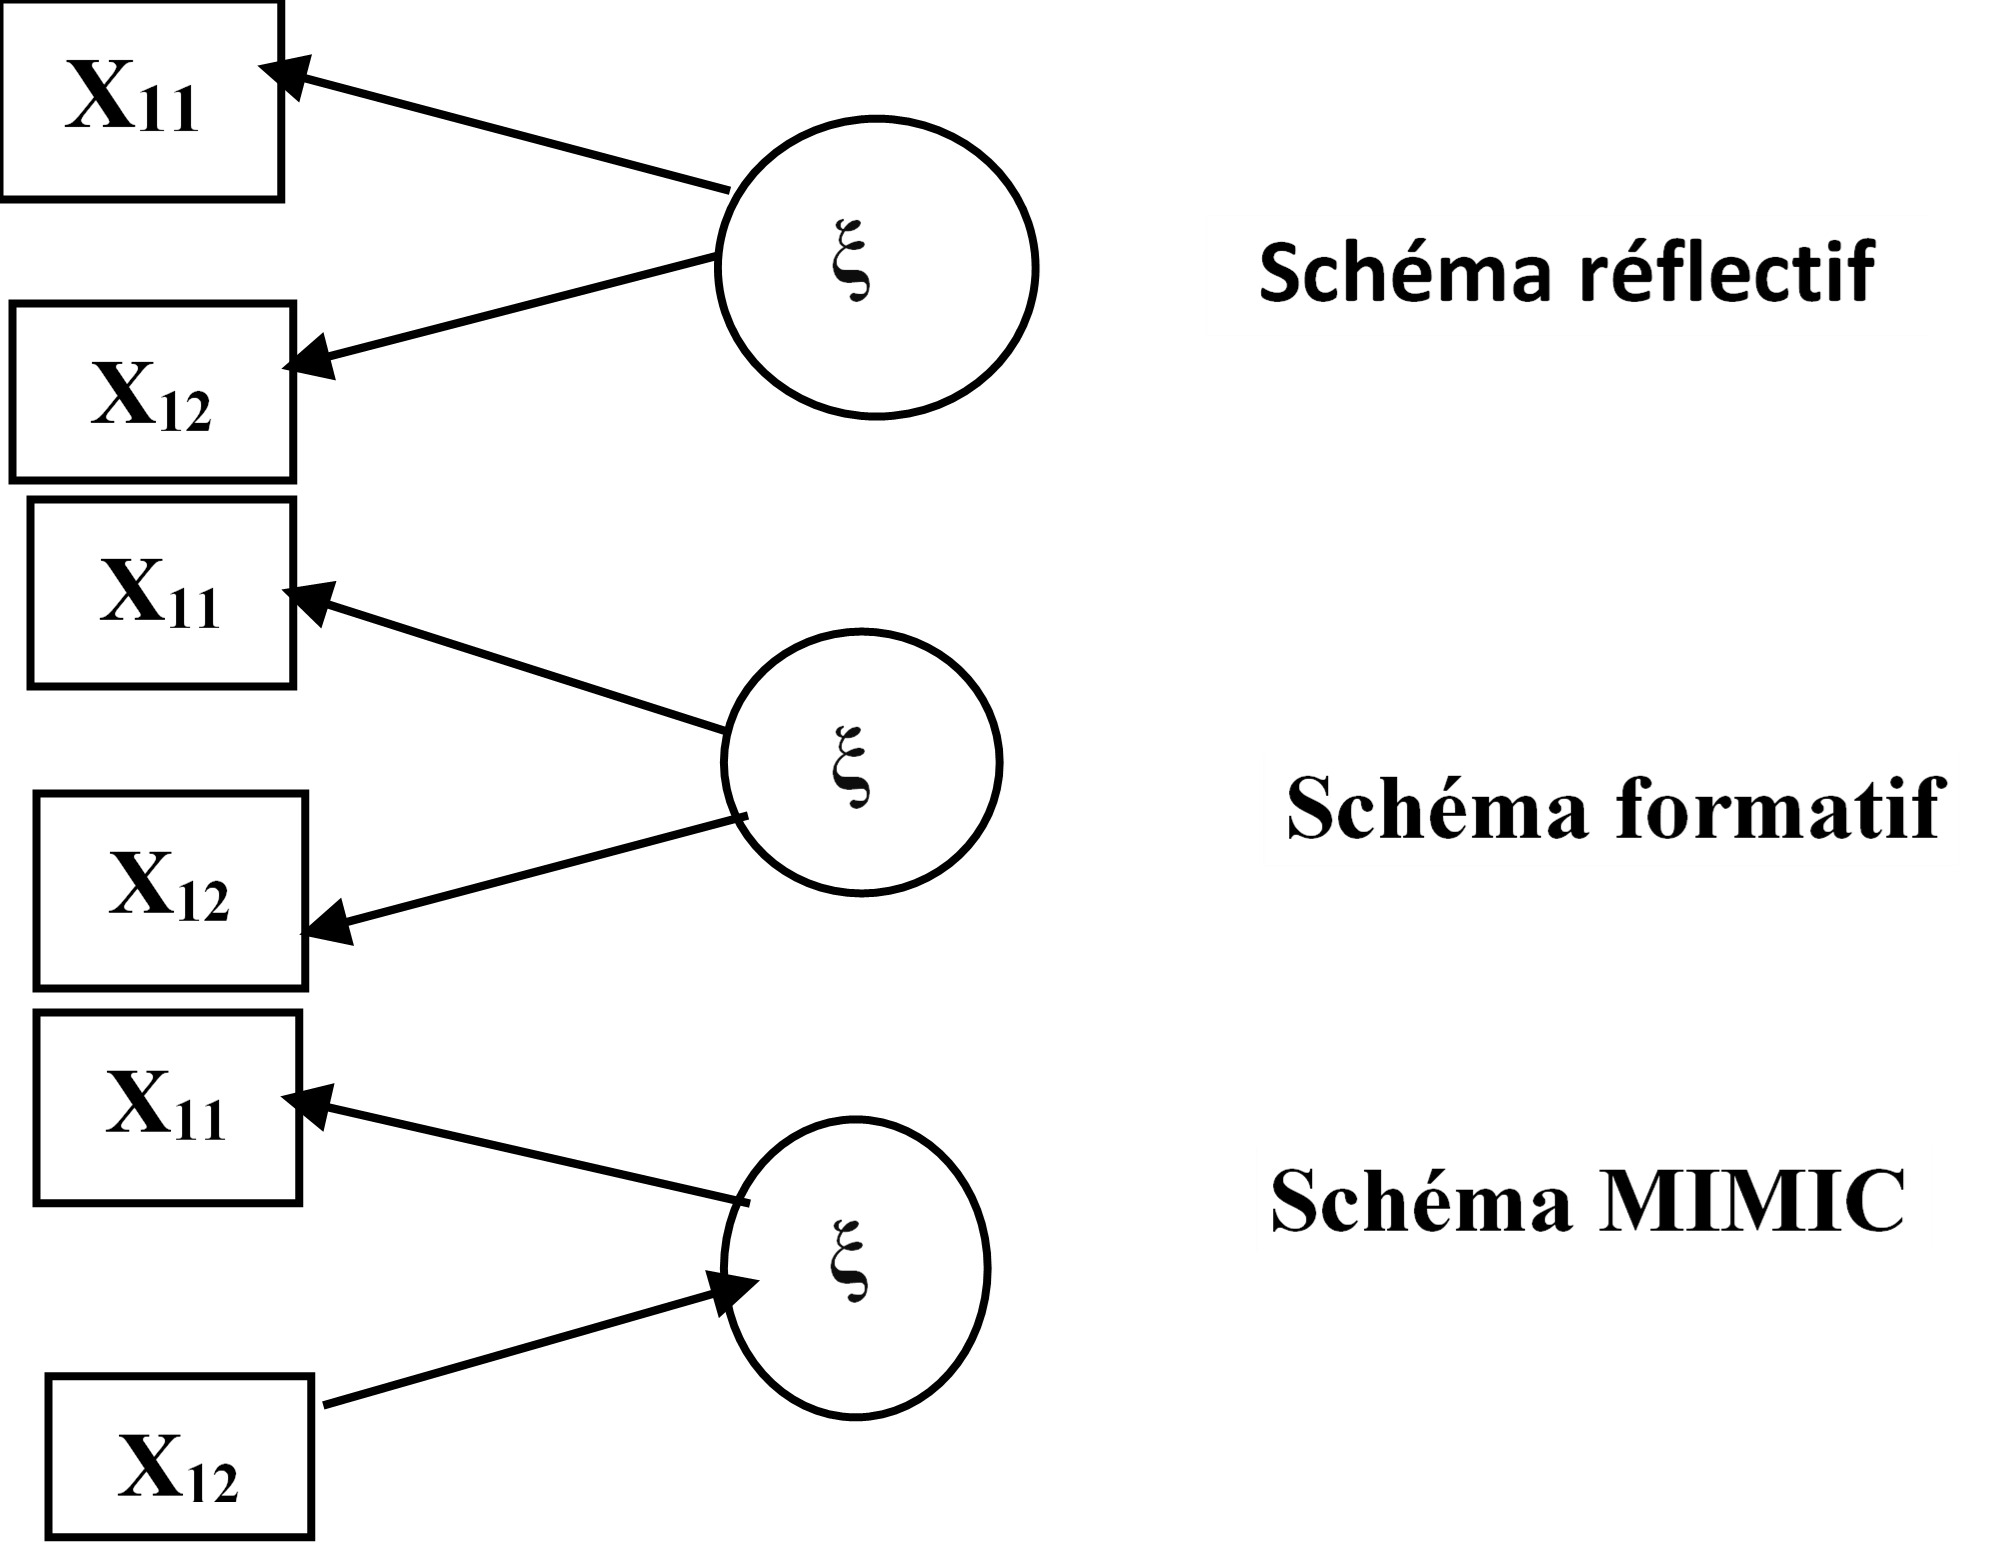
According to Jarvis, in the formative scheme, the relationship is reversed: the following conditions justify modelling a construct in a formative mode: firstly, the indicators are seen as characteristics defining the construct; changes in the indicators are supposed to cause changes in the construct; secondly, changes in the construct are not supposed to cause changes in the indicators; thirdly, the indicators do not necessarily share a common theme; fourth, eliminating an indicator can alter the conceptual domain of the construct; fifth, a change in the value of one of the indicators is not necessarily assumed to be associated with a change in all the other indicators and, sixth, the indicators are not assumed to have the same antecedents and manifest variable consequences (fig.2).11
This variable is then a linear function of its manifest variables plus a residual term. In this mode, the block of manifest variables can be multidimensional. However, the formative mode should not be used as a simple alternative to the problem of the unidimensionality of a construct.9 Finally, in the mixed schema, there are these two types of relationship (reflective and formative) [9] (Table 2).
At the end of the entire specification procedure, the external model was presented synthetically in its algebraic form as a system of three following equations:
Profzs = α0 profzs0 + α1 profzs1 popzs+ α2 profzs 2numeras + α3 profzs3 ratemorta+ α4 profzs4 rate morbid+ α5 profzs 5 util.serv+ rates α6 teachers 6 numbers5 km+ α7 teachers 7 number ofpeoplebcz + ξ teachers;
Devofsesa = β0 devofsesa0 +β1devofsesa1 centrediag+β3 devofsesa2 cabparamed+ β4 devofsesa3 cabmed+ β5 devofsesa4 pharmpriv+β6 devofsesa5 fosaspec+ β7 devofsesa6 foapriv +ξ devofsesa Devofsesa = λProfzs + K
After specifying the model, it was estimated to determine the value of the coefficients obtained.
Estimation of the model
Estimation methods
Two methods can be used to estimate the parameters of structural equation models: maximisation of the likelihood, which corresponds to the analysis of the covariance structure, known as the LISREL (Linear Structural Relationship) method developed by Jöreskog in 1970, and minimisation of the variance of the residuals, known as the PLS (Partial Least Squares) approach [9]. A number of elements diverge or converge between these two methods. However, according to Jakobowicz, the two approaches are complementary rather than competing [9,10].
Choice of estimation method
In this study, the latter approach was chosen for a number of reasons. Firstly, the use of PLS in structural equation models, known as Partial Least Squares Path Modeling (PLS-PM), was preferred because of the different types of relationships between latent variables and measurement variables that it can model.9 Indeed, the PLSPM approach models the two main types of schema (reflective and formative) of the external model.11 In addition, the PLS-PM approach has several other advantages, such as the absence of a multi normality assumption, the handling of missing data and the small sample size required.
Model evaluation criteria and indicators
'Once it had been estimated, the model was subjected to the evaluation procedure according to the criteria traditionally applied in this field, in this case: internal consistency, goodness of fit, convergent validity and discriminant validity. As a reminder, the criteria are specific to the type of model in question. Box 1 and Table 3 summarise the validity criteria used in this study.
Model evaluation procedure
The following criteria are often used to help assess the measurement or external model: the reliability of internal consistency or of the measurement scales, the unidimensionality of the constructs, the convergent validity of the measures associated with the constructs and discriminant validity. According to Balambo, in general, conclusive tests of reliability and unidimensionality of the blocks are sufficient to attest to the good quality of the measurement model.9
Firstly, the unidimensionality of blocks is used in this study to check whether the manifest variables associated with each block form a single block or a whole. The unidimensionality of a block is verified by studying the eigenvalues obtained from the principal component analysis:the first eigenvalue must be greater than 1 and the second less than 1 or much less than the first[9].
Secondly, convergent validity requires that a manifest variable should be more correlated with the latent variable it is intended to measure than with the others. As it is not necessary in the case of formative constructs, convergent validity of the measures is based on an examination of the correlations (loadings) of the measures with their respective construct.9
It assumes that the manifest variables must be more correlated with their representative latent variable than with the other blocks of the model. Thirdly, discriminant validity implies that each latent variable must be more correlated with its indicators than with the other latent blocks. Discriminant validity represents the extent to which measures of one construct differ from measures of another construct in the model. Discriminant validity is measured by comparing the mean variance with the shared variance between the construct and the other constructs in the model (squared correlations between latent variables). The AVE of each VL must be greater than the square of the correlation between this VL and the others. Discriminant validity verifies that VMs are more related to their VL than to the other VLs. This validity ensures that the constructs are distinct. This means that a construct must share more variance with its measures than it shares with the other constructs in the same model. If these tests are conclusive, the good quality of the measurement model can be certified.12
As far as the evaluation of the internal model is concerned, it corresponds to a test of the hypotheses formulated. The structural model is tested by calculating indices to assess how well the model fits the data. Firstly, an index is calculated to assess the goodness of fit of the measurement model to the data: the “community or communality index”. Secondly, the regression coefficient assessing the goodness of fit of the structural model to the data for each endogenous block, taking into account the measurement model, is also calculated.10
Finally, the evaluation of the global or ensemble model is a global evaluation of the model’s predictivity. No global model validation index exists in the PLS approach, as is the case for the LISREL method cited by Fernandes.4 However, some authors present the Goodness of Fit (GoF) index as a solution to this problem. The GoF index is the geometric mean between the mean communality (which measures the performance of the external model) and the mean R² (which measures the performance of the internal model), so it evaluates the overall performance of the model.13
The values of the GoF index are between 0 and 1 (0 < GoF < 1). The GoF is a descriptive index and, as such, there is no empirical threshold for evaluating it. Nevertheless, a GoF greater than or equal to 0.9 can be considered to indicate a good fit of the model to the data.11
After this assessment, we move on to the hypothesis test, which is based on observation of the coefficients of determination and the validity and magnitude of the structural coefficients. For the hypotheses to be valid, the coefficients of determination must be greater than 0.1 (R²>0.1). Similarly, structural coefficients (path coefficients) must be greater than or equal to 0.2 to be considered valid and greater than 0.3 to be considered significant.11 Ultimately, it is the structural coefficients that form the basis of the entire interpretation of the model with regard to the hypotheses formulated, and make it possible to confirm or refute them.14
RESULTS
The estimated structural model
After estimation, the structural model obtained is presented in the following algebraic form:
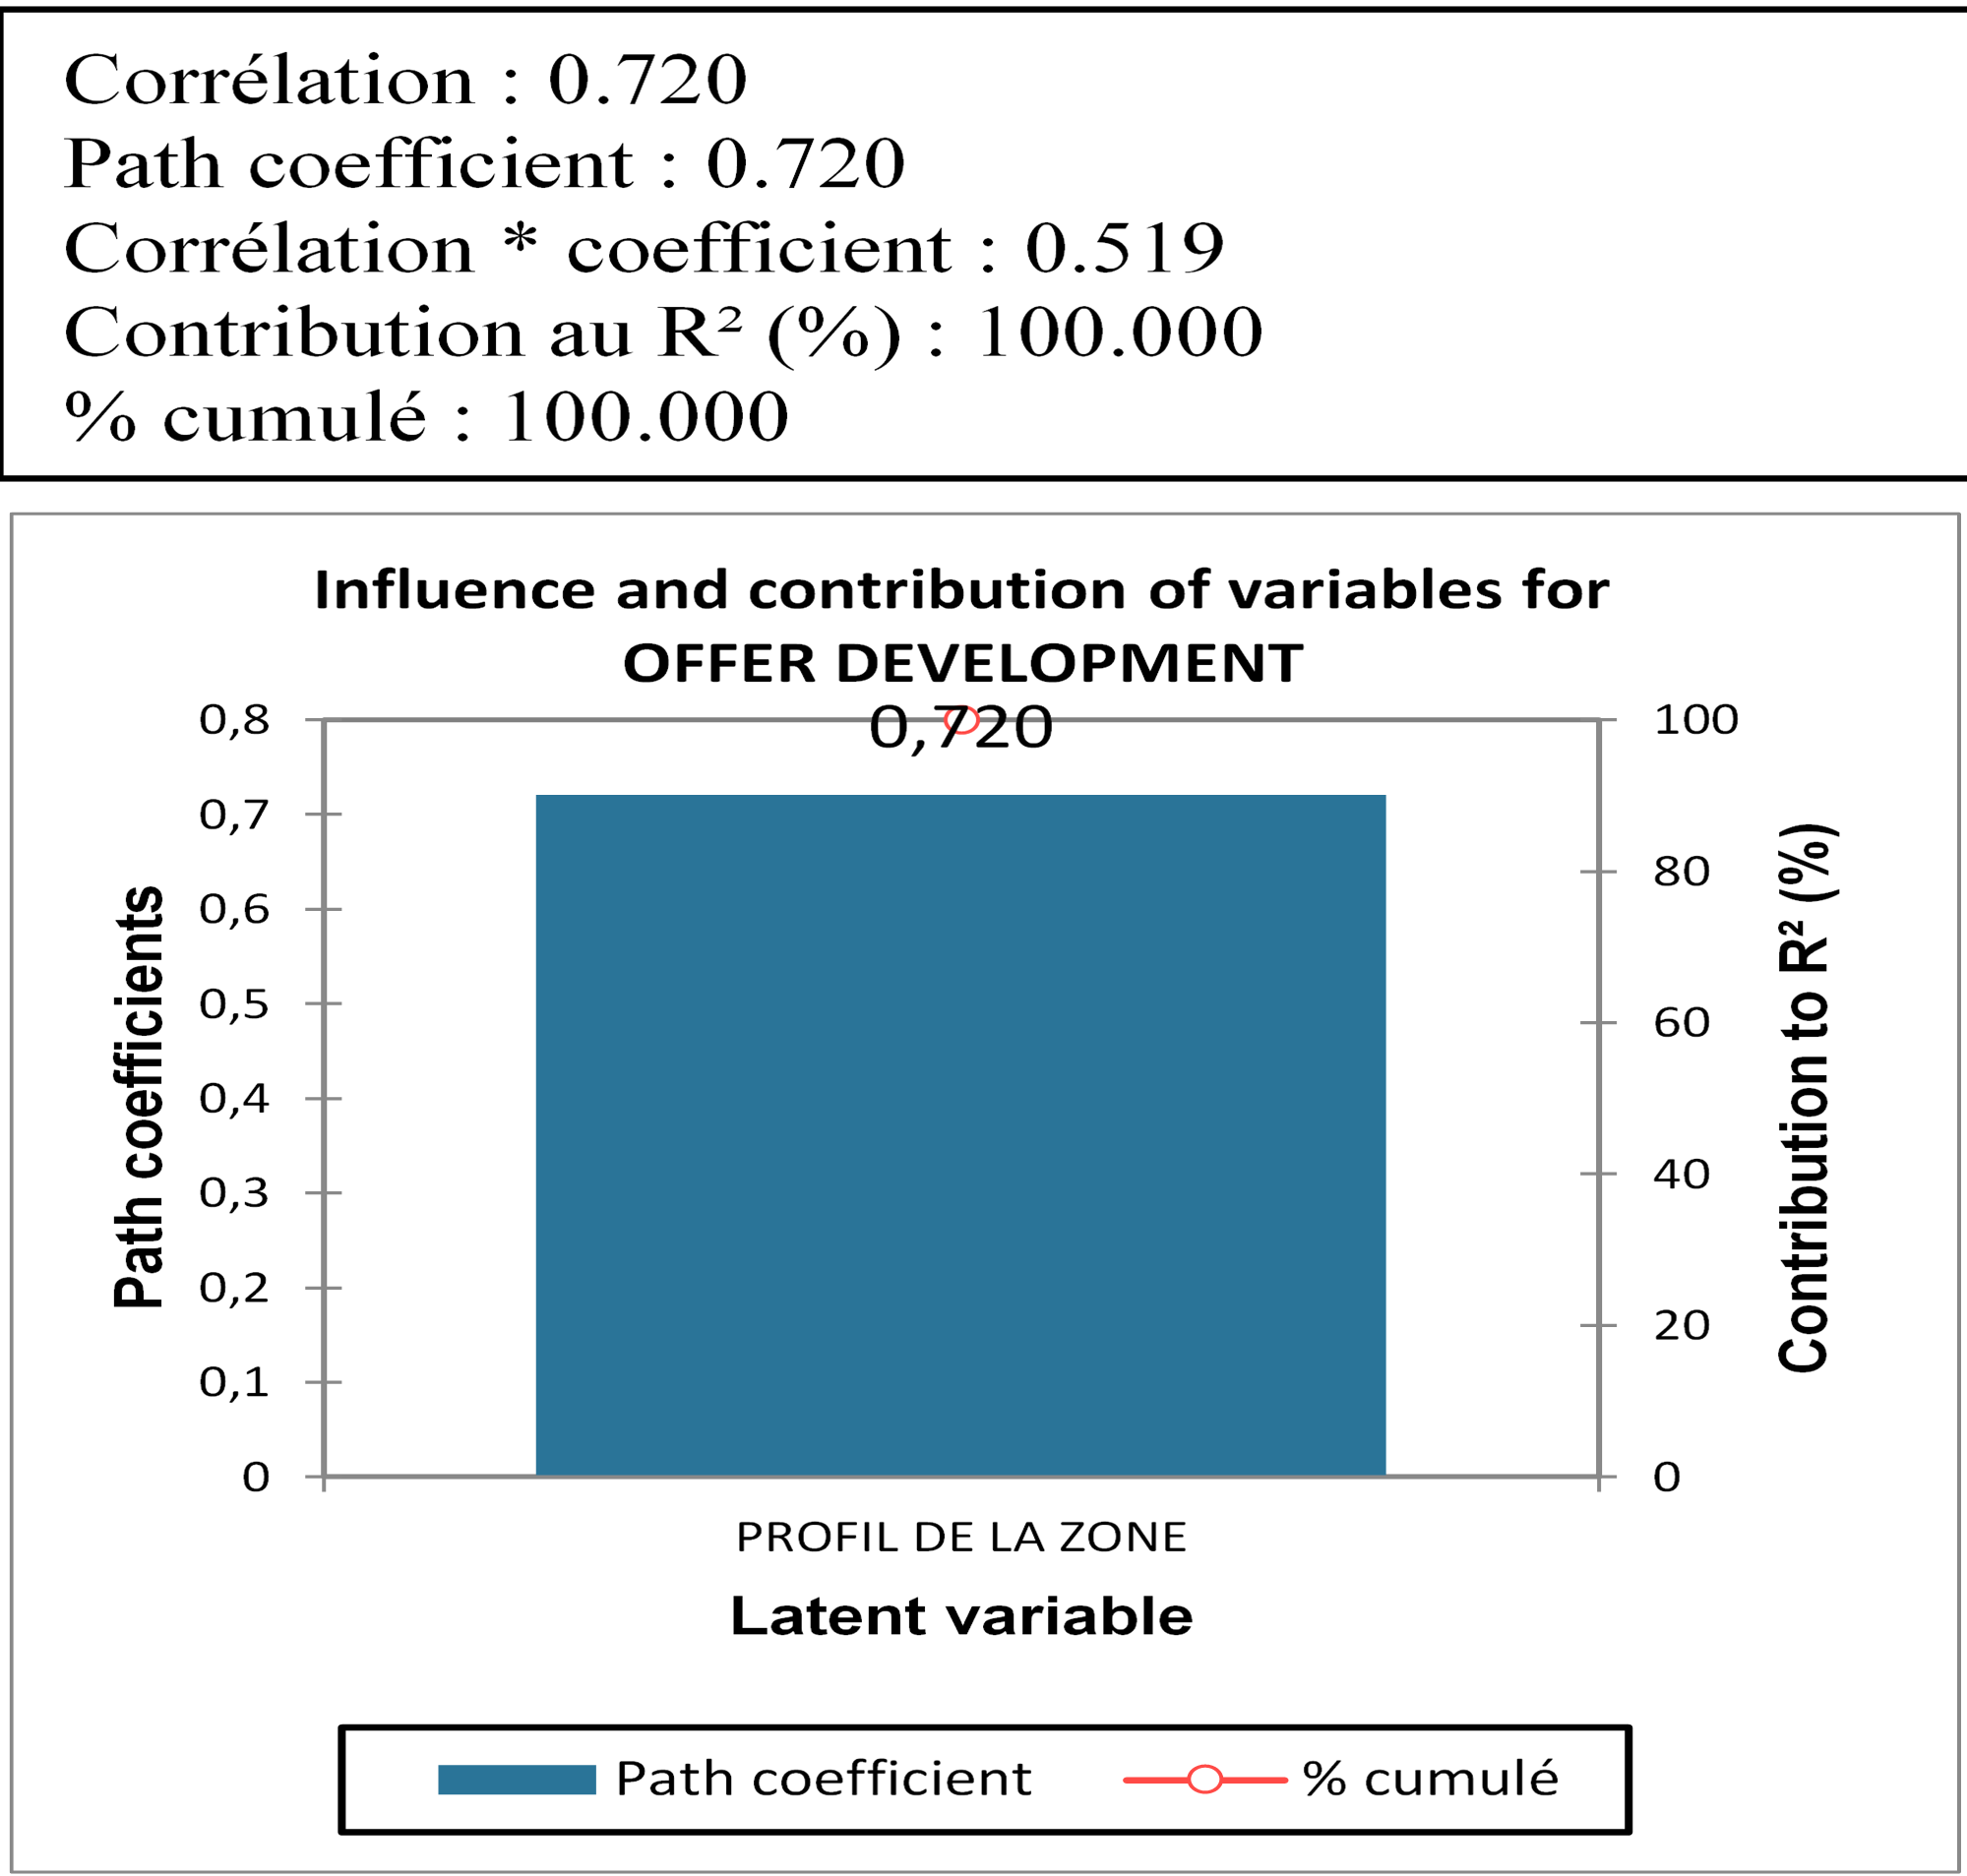
Devofsesa = 0 .720311734742578* Profzs
According to the estimation results, there is a positive and significant causal relationship between the profile of the health zone and the development of the private supply of health care and services (0.720). The detailed estimation results of the entire model are shown below (Figures 4 and 5). However, to be statistically valid, the estimated model must be evaluated
External model
The external model has two parts corresponding to the two blocks. The estimation of these two distinct equation systems made it possible to measure the relationships between the variables and their indicators in each block.
Correlations between latent variables and their indicators
By looking for correlations between latent variables and their indicators, the aim is to find the indicators that most influence their latent variables. According to the results of Table 5, it appears that the number of paramedical practices (0.930) and the number of diagnostic centers (0.907) are the variables which most reflect the development of the offer in relation or comparatively to others. In addition, the mortality rate (0.724) and the number of qualified personnel at the BCZS (0.489) are the indicators that most influence the profile of the health zone.
External weight of indicators on latent variables
These results were subjected to the required tests for statistical validation before their interpretations.
The relationship between the different variables likely to describe the profile of the health zone and the latter is positive, with the exception of the number of AS (-0.343) .and rate of use of services (-0.273). Likewise, the majority of variables likely to reflect the development of the supply of health services are positively linked to the latter. These are: number of specialized health facilities (0.289), number of private pharmacies (0 .136), number of medical practices (0.172), number of paramedical practices (0.172) and number of diagnostic centers (0 .259). On the other hand, the total number of private health facilities (-0.033) has no influence on the development of the private supply of health care and services.
Evaluation of the estimated model
Internal model
R² Values for Supply Development and Values of Path coefficients and their t-test for the Health Zone Profile
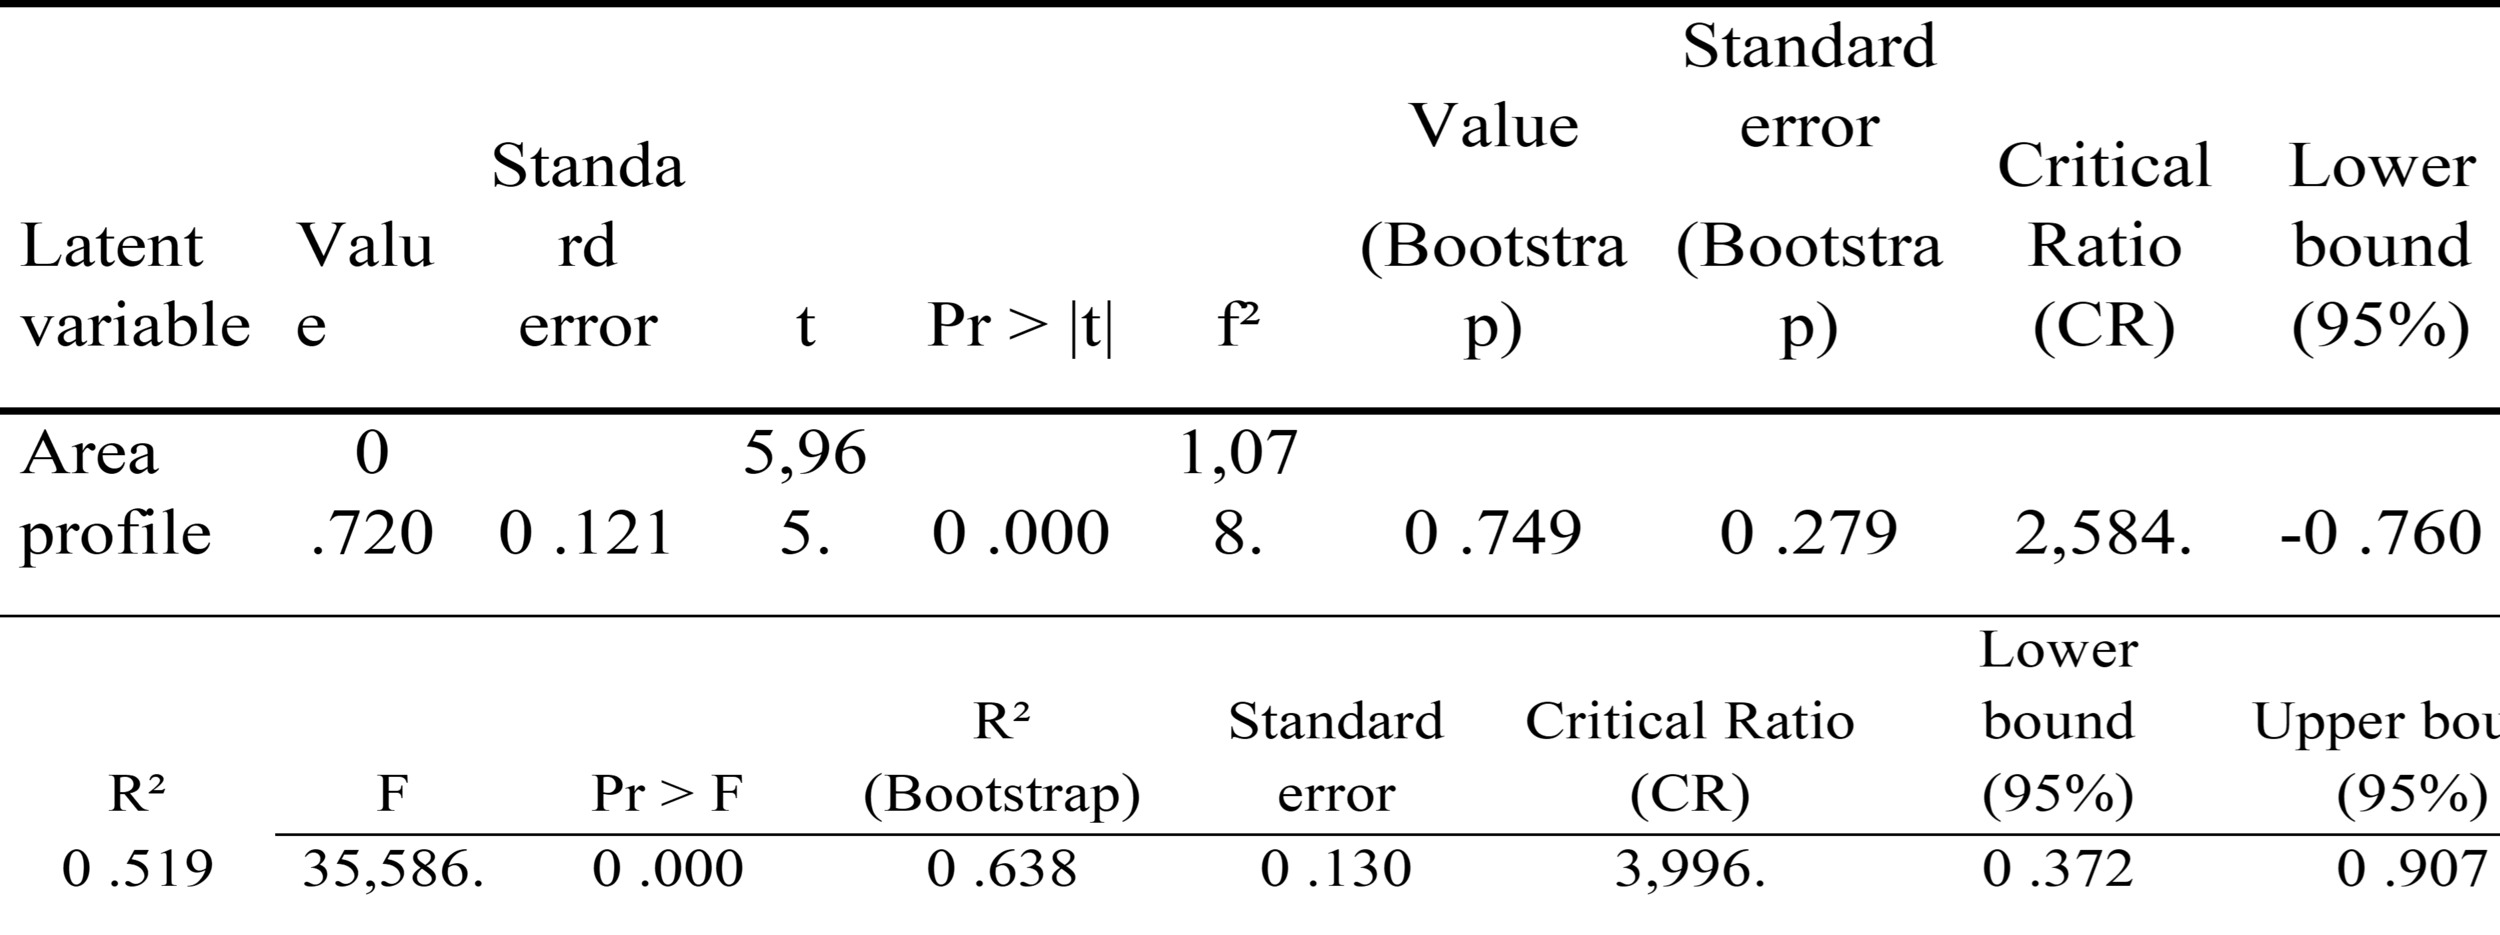
According to the results of the Table 5, the profile of the health zone influences positively and significantly, at the 1% threshold, the development of the private supply of health services (Path coefficient = 0.72). In other words, if the profile of the health zone increases by one point, the development of private provision will increase by 0.72 points. Consequently, the model explains the contribution of the health profile to the development of private provision by almost 72%, and, as a result, the exogenous variable retained in this model (health zone profile) has a significant effect. and positive on the development of the private supply of health services and care. Roughly speaking, the The profile of the area has a predictive nature on the development of the private supply of health services. Indeed, the relationship is significant and positive with a structural coefficient of 0 .519, as a contribution to R2 of 100 % and a critical ratio of 2.584. The variation in the development of private healthcare provision is 51.9% explained by that of the profile of the health zone
External model
The validation of the results focused on the analysis of the formative and reflective diagrams through the following criteria: unidimensionality, convergent validity and composite reliability of the blocks (Table 6).
Checking the unidimensionality of blocks
The unidimensionality of a block is verified by studying the eigenvalues resulting from the principal component analysis, and the validity criterion is that the first eigenvalue must be greater than 1. Table 7 and 8 indicate that each of the two blocks is one-dimensional. Indeed, for the health zone profile, the eigenvalue is 2,153 and for the development of private health care provision, the eigenvalue is 3,753 .To talk about validity convergent, it is necessary that the correlations between indicators can be: either acceptable (AVE>0 .50) or good (AVE>0 .70). Although this block is formative, its convergent validity was verified. The different manifest variables of the block are positively correlated with the first factor and their intensities greater than 50%, with the exception of those of the mortality rate and morbidity rate. Thus, there is reason to admit that the convergence in this block is validated.
Evaluation of the structural model global
As a reminder, the aim of evaluating the overall model is to judge the quality of fit of the latter to the statistical data reflecting the different indicators (19). The GoF criterion required in this case was used.
Below presents the GoF values
According to the results in Table 9, the GoF values are relatively low (<0.5), except for the internal model (GoF = 0.804). As a reminder, the GoF of the internal model gives an assessment of the quality of structural relationships. In addition, the following three results of the estimated model allow us to draw relevant conclusions. First, the GoF values before and after bootstrap show too little difference, which allows us to conclude that the model is stable. Then, the critical ratio (CR) of the GoF t-test concerning the internal model is very high (11.742.) > 1.96. From the above, it can be affirmed that this model has statistically significant predictive powe.

Health zone profile variable has good modeling quality and high explanatory power ( R2= 100%). The profile of the zone is significantly described by the factors associated with it, more particularly by the mortality rate (0.724 .), the number of qualified BCZS personnel ( 0.421 .) and the number of health areas ( - 0 .343 ). Overall, it is interesting to note that the contribution and influence of the area profile are high (PC = 0.720 ., RC = 2.584 .and R2 = 100%).
DISCUSSION
The empirical analysis of this study reveals several key findings. Firstly, the profile of the health zone is crucial for the development of private healthcare provision in urban areas. This finding aligns with the results of a study conducted in Ouagadougou, Burkina Faso, which examined the relationship between spatial growth and the evolution of modern healthcare structures in the city.15 In the context of Kinshasa, the study identified the mortality rate as the most significant factor influencing the health zone profile, with an external weight of 0.793 (79.3%), followed by the number of qualified BCZS personnel, which had an external weight of 0.421 (42%). The high maternal mortality rate in the DRC may partly explain the emphasis on mortality as a key determinant.16 Furthermore, it is widely recognized that the quality of healthcare services and patient safety are closely linked to human resources, including their technical and non-technical skills, workload, working conditions, continuity of care, and overall activity levels.15,16
Interestingly, the study found that the service utilization rate (-0.273) and the number of health areas (-0.343) did not have a positive influence on the health zone profile, indicating that these variables do not drive changes in urban health dynamics in the same direction. This suggests that variations in these factors do not directly correlate with shifts in the health zone profile.
Regarding the development of private healthcare provision, the number of paramedical practices emerged as the most indicative variable (external weight of 0.293), followed closely by the number of specialized health facilities (external weight of 0.289). This is consistent with findings from Burkina Faso, where the spatial distribution of healthcare establishments varies significantly between public and private sectors. Public facilities tend to be evenly distributed to promote equitable access, while private establishments are often concentrated in city centers and near major transportation routes, reflecting a commercial logic.15
The results of this study further indicate that the development of private healthcare provision is not merely about the overall number of private health facilities but is more closely linked to specific types of services, such as paramedical practices, specialized health facilities, and diagnostic centers. The prominence of paramedical practices could be attributed to the growing number of paramedical training institutions in the DRC and the accessible nature of services provided by professionals like nurses and medical assistants. Additionally, the demand for specialized medical assessments by expert physicians drives the need for specialized health facilities and diagnostic services.
Limitations
This study has several limitations that should be considered when interpreting its findings. Firstly, it does not account for variables related to faith-based healthcare providers, non-profit organizations (Asbls), or other providers not identified by the health zone or listed by the Directorate of Health Services (DPS). Secondly, the methodological approach used in this study, the Partial Least Squares Path Modeling (PLS-PM), does not consider measurement errors, which might affect the precision of the results.
Despite these limitations, the selected factors in this study are considered relevant and represent the primary elements influencing the health zone profile and the development of private healthcare services. Furthermore, the PLS-PM approach is suitable for investigating the relationship between latent variables that are not directly measurable, making it an appropriate tool for understanding health zone management dynamics in the DRC.
Conclusions
In conclusion, this study has identified the key determinants of entrepreneurship in the healthcare sector in Kinshasa, the capital of the Democratic Republic of Congo. The findings emphasize the significant role that the private healthcare sector plays in the DRC’s health system, especially in addressing health challenges and advancing the goal of universal health coverage as outlined in the PNDS 2024-2033. The primary objective was to investigate the relationship between the health zone profile and the growth of private healthcare providers in Kinshasa.
Through an exploratory, quantitative approach using a latent variable structural equation model based on the PLS-PM method, the study yielded three main findings. Firstly, the health zone profile was found to have a significant and positive influence on the development of private healthcare services (coefficient of 0.720). Secondly, the mortality rate was identified as the most influential factor affecting the health zone profile (external weight of 0.793), followed by the number of specialized BCZS staff (external weight of 0.421). Lastly, the study highlighted that the number of paramedical practices is the most significant variable reflecting the development of private healthcare services (external weight of 0.293), closely followed by the number of specialized health facilities (external weight of 0.289).
These findings provide valuable insights into how the expansion of the private healthcare sector in Kinshasa can be strategically aligned with broader efforts to improve health outcomes and advance towards universal health coverage in the DRC. By focusing on key determinants like mortality rates and specialized healthcare services, policymakers and stakeholders can make informed decisions to strengthen the healthcare system and address the pressing health needs of the population.
Acknowledgements
We are grateful to Hortense Atakana, Yacine Mbuyi and Shekinah Kanku for their intellectual support.
Ethics statement
The research protocol for our study was submitted to the ethics committee of the school of public health of the university of Kinshasa (ESP) for approval. We received approval under number ESP/CE/152/2023 of March 26, 2023, Kinshasa School of Public Health Ethics committee. The informed consent was obtained from all participants involved in the study.
Funding
None.
Authorship contributions
All the authors mentioned met these 4 criteria:
-
Substantial contribution to the conception or design of the work; or to the acquisition, analysis or interpretation of data for the work; AND
-
Drafting of the work or critical revision of the important intellectual content; AND
-
final approval of the version to be published; AND
-
Accept responsibility for all aspects of the work, ensuring that issues relating to the accuracy or integrity of any part of the work are properly investigated and resolved.
Modelling the determinants of private health entrepreneurship in Kinshasa, DR. Congo.
Disclosure of interest
None.
Correspondence to:
Nsubile Nsubile Clement
Department of Management, Kinshasa School of Public Health University of Kinshasa, Kinshasa, DRCongo
subilesubile@gmail.com