INTRODUCTION
The opening up of the healthcare market to private investors in DR Congo has led to a flourishing of nursing institutions (out of 478 IM/ITM, 169 are private, 164 denominational and 145 official) and training institutions for doctors. This phenomenon has contributed to the country’s plethora of human resources in health. For example, the total number of nurses has risen from 52329 in 2009 to 101752 in 2021, and the number of doctors from 3817 in 2009 to 11947 in 2021. What’s more, given the meagre public resources allocated to health, the proportion of staff benefiting from state-paid salaries in the DRC in 2015 was 40%. As a result, health professionals have been pushed into private health entrepreneurship.1–5
Statistics from the Ministry of Health indicate that there are around 16671 first-level health care and service establishments (ESS) in Kinshasa, of which 9947 are private, i.e. around 60%. According to the same source, the second echelon comprises around 1962 with 1460 private ESS, i.e. 75% of this category. The third echelon has two private ESS out of a total of 8, or 25%, and the fourth has three ESS out of 10, or 30%.2,5–9 The weight of the private sector in the healthcare landscape is truly asserted. Hence the interest of this study in determining the managerial factors of private entrepreneurship in the healthcare sector on the level of activity in private ESS.
Apart from the introduction and conclusion, this study is divided into three sections. The first deals with the methodology of the study, the second with the results of the research and, finally, the last with the discussion of these results.
METHODS
This study was carried out in the N’sele urban-rural health zone, which has 170 ESS, 149 of them private (i.e. 88%). This cross-sectional analytical study focuses on private ESS in the said HZ and covers the year 2022. The target population for this study is all the private healthcare establishments in the N’sele health zone. The private healthcare facility is the first statistical unit targeted, and from this, another statistical unit retained is the private healthcare contractor.
Based on the list of 15 AS (Aire de Santé) in the ZSUR (zone de santé urbano-rurale), and after excluding 8 AS on the grounds of inaccessibility and insecurity, the remaining 7 AS were retained in their entirety. Subsequently, the quota sampling technique was applied to select the ESS. To this end, 30% of private ESS were selected in each health area, using systematic sampling with a sampling step of 3, based on the list of ESS in each health area obtained from the BCZS.
Data collection took place from September 15 to November 23, 2023, using two research techniques. Firstly, structured interviews were carried out using two closed questionnaires on Kobocollect, one administered to the ESS manager and the other to the entrepreneur associated with the latter, or the manager in the entrepreneur’s absence. Next, the documentary technique was applied, consulting reports and any other documentation available in the ESS and likely to provide the information sought, using a form to collect the latter. All authorizations were obtained prior to data collection. At the end of data collection, the collected data were exported from Excel to SPSS 26 and AddinSoft for processing and analysis. Categorical data were summarized in terms of proportions, while quantitative data were expressed in terms of mean and either standard deviation or median, depending on their distribution. Subsequently, the various associations were examined and measured between, on the one hand, the entrepreneur’s profile and that of the private ESS and, on the other, the latter’s level of production. To this end, the Chi-square test and the latent variable structural equation method are the two main techniques applied to analyze this relationship. Throughout this study, the ethical principles of health research were respected, from data collection to the presentation of results. In particular, before any interview, free and informed consent was obtained from the respondent, and confidentiality of information was guaranteed by coding the data.
RESULTS
Profile of private healthcare entrepreneurs
In other words, most private entrepreneurs in the healthcare sector are married men with higher education qualifications, working as nurses. Moreover, the most common age bracket is between 41 and 50.
SSE production factors
With regard to the labor factor, most of the private healthcare facilities surveyed do not have an emergency department, and have fewer than 7 employees. They operate without doctors or administrative staff. In terms of infrastructure, around half of these facilities have a capacity of less than 10 beds, with fewer than 6 beds occupied by patients. The ratio is approximately 8 beds per doctor and 2 beds per nurse.
Level of SSE production or activities
The study shows that the median length of stay in private healthcare facilities was 4 days, with a minimum of 2 days and a maximum of 30 days. The median length of stay ranged from 3 days for minor surgery, through 5 days for internal medicine, to 7 days for maternity. What’s more, the vast majority of these facilities have an average length of stay of less than 4 days,
Statistical measurement of the relationship between production factors and the activity of private SSEs in the N’sele health zone
The study shows that the median length of stay in private healthcare establishments is 4 days, ranging from 2 to 30 days. This ranges from 3 days for minor surgery, through 5 days for internal medicine, to 7 days for maternity. What’s more, most of these facilities have an average length of stay of less than 4 days.
Econometric measurement of the relationship between the profile of the private entrepreneur, the organization of production factors and the volume of activity in private healthcare and service establishments in the N’sele health zone
The profile of the private health care entrepreneur has a positive and significant impact on the organization of production factors in health care establishments (impact coefficient of 0.487).similarly, the profile of the private health care entrepreneur has a positive, albeit non-significant, effect on the level of production or activity of these establishments (impact coefficient of 0.254).furthermore, the organization of production factors in health care establishments has a positive and significant effect on their level of production or activity (impact coefficient of 0.439).
Characteristics of private healthcare establishments and services
According to table 1, almost a quarter (24.6%) of the private ESS surveyed are located in the Mpasa1 health area, followed by AS Badara (17.5%). ESS in Bibwa are the least represented (7%).
Characteristics of the private healthcare contractor
From a socio-demographic point of view, table 7 shows that half of the private ESS entrepreneurs surveyed in the N’sele health zone are between 41 and 50 years old, almost 8 out of 10 are male and 9 out of 10 are married. In terms of qualifications and profession, around 8 out of 10 entrepreneurs surveyed had attained a higher or university level of education, and almost 6 out of 10 were nurses.
Quantity of production factors used and volume of activity carried out in private healthcare establishments
According to table 13, the median number of staff across all ESS is 7. The median number of nurses, at 7, is far higher than the median number of doctors, and the median number of administrative staff, at 1, is very low. The same table shows that the median number of beds is 10 for ESS. The median number of beds per doctor is higher than the median number of beds per nurse, while the median bed occupancy rate is 6. The median work factor values show the preponderance of nursing staff in half of the ESS. In addition, the median values for the capital factor show that half the ESS surveyed have more than 10 beds and an occupancy rate of over 6. In other words, capital utilization is greater than 6 in half of all ESS, on the one hand, and this is made up of entry-level ESS, on the other.
According to table 11, the median stay recorded in the ESS as a whole is on average 4 days, with a minimum of 2 and a maximum of 30. In contrast, in the different departments within the ESS surveyed, the median stay is more or less wide or extensive: it varies between values of 3 days for minor surgery to 7 for maternity.
Table 5 shows that, in general, more than half (52.6%) of ESS recorded an average length of stay of less than 4 days. On the other hand, in the various departments, almost 9 out of 10 ESS (87.7%) had a proportion of maternity stays that was less than 7 days, while the proportion of stays in minor surgery was less than 3 days in more than half (54.4%) of ESS, and the proportion of stays in internal medicine was less than 5 days in almost 9 out of 10 ESS (87.7%).
Statistical analysis of the association between the quantity of production factors and the volume of activity in private healthcare facilities in the N’sele health zone
To measure the relationship between production factors and activity in private healthcare facilities in the N’sele health zone, the Chi-Square statistical test was applied to the relevant measurement variables.
According to table 13, application of the Chi-2 test to the relationship between staff numbers and length of stay shows that the statistical association is verified only between the average length of stay in the ESS (p=0.032 < 0.05) and the share of stay in minor surgery (p=0.005 < 0.05), on the one hand, and the total number of ESS staff. In other words, the total number of ESS staff was not statically associated with the share of internal medicine stays (p=0.088> 0.05) and the share of maternity stays (p=0.4 >0.005).
According to the results in Table 7, the average length of stay in the ESS as a whole and the shares of stay in the various departments (p > 0.05) are not statistically associated with the number of physicians in the ESS.
Table 8 shows that only the average length of stay in the ESS (p= 0.022 < 0.05) is associated with the number of ESS nurses.
The results in table 9 show that the proportion of maternity stays (p= 0.001 < 0.05) and minor surgery stays (p= 0.029 < 0.05) are statistically associated with the number of ESS administrative staff.
The results in table 10 show that the average length of stay in the private ESS as a whole and the share of stay in each different service within the ESS (p < 0.05) are statistically associated with the ESS’s capacity.
According to the results in table 11, the average length of stay in the ESS as a whole, and the share of stay in each ESS department in particular (p < 0.05), are statistically associated with ESS capacity.
The results in Table 12 show that the average length of stay in the ESS as a whole (p = 0.001 < 0.05), the average length of stay in minor surgery (p=0.002 < 0.05) and that in internal medicine (p= 0.045 < 0.05) are statistically associated with the number of beds per physician in the ESS.
Table 13 shows that the average length of stay in the ESS as a whole and the proportion of stays in minor surgery are statistically associated with the number of beds per nurse in the ESS.
Econometric analysis of the relationship between the profile of the private healthcare entrepreneur, the organization of production factors and the volume of activity in private healthcare and service establishments in the N’sele health zone
According to the results in Table 14, the unidimensionality of the blocks is globally respected, for the following reasons. With regard to the latent variable “Profile of the private health entrepreneur”, the first eigenvalue is 1.818 (> 1), and the subsequent eigenvalues of this variable are lower than the first. With regard to the latent variable “Organization of production factors in the ESS”, its first eigenvalue is 4.459 (>1) and its subsequent eigenvalues are lower than the first. Finally, the third latent variable, “Level of production/activity in ESS”, also satisfies the block unidimensionality norm: its first eigenvalue is equal to 3.163 (>1), and subsequent eigenvalues are lower than the first. In other words, each block is unified.
A reading of Table 15 suggests that the empirical thresholds for the coefficients of determination and structural coefficients are satisfactory, as they are higher than the norm, which is “greater than 0.1”. Indeed, the correlation coefficient between the Profile of the private health entrepreneur and the Organization of production factors in the ESS is 0.237. Similarly, the correlation coefficient between the Profile of the private health entrepreneur and the Level of production/activity in the ESS is 0.119. Furthermore, the correlation coefficient between ESS Organization of Production Factors and ESS Volume of Activity has a value of 0.247. All the correlation coefficients concerned have satisfactory values (> 0.1, which is the norm).
With these basic conditions satisfied, the structural equation of the estimated model can be presented as follows:
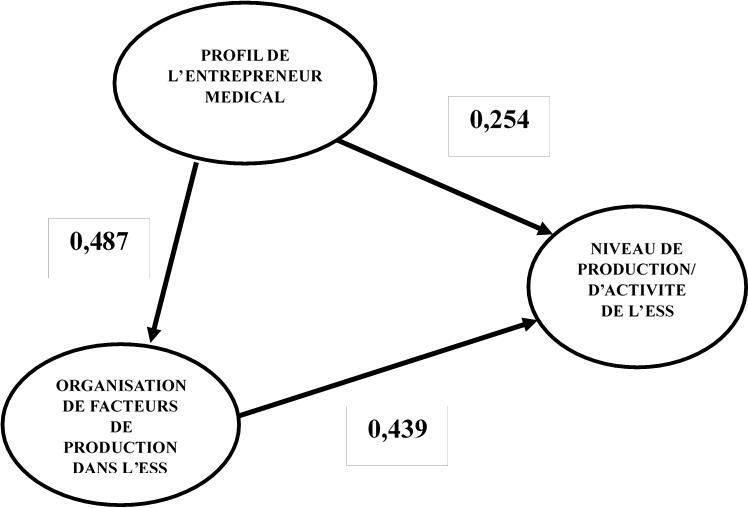
Level of ESS production/activity=0.439 Organization of production factors in the ESS +0.254 Profile of the medical entrepreneur
Schematically, it can be presented as in Figure 1.

The estimation results show that the entrepreneur’s profile has a greater influence on the organization of production factors (0.487) than on the level of activity (0.254). On the other hand, the organization of production factors has a greater influence on the level of production (0.439).10,11
DISCUSSION
Profile of private healthcare contractors
The results of this profile show that the vast majority of private healthcare contractors are male, married and have higher education qualifications. Similarly, the majority are nurses, half of whom are in the 41-50 age bracket. In other words, higher-level nursing staff are largely dominant in private health entrepreneurship in urban-rural areas.
ESS production factors
With regard to the labor factor, it emerged that the vast majority (70-80%) of private ESS surveyed have no emergency service and use fewer than 5 nurses, while the majority (60%) of ESS have few staff in general (a staff complement of less than 7) and operate without doctors or administrative staff. In other words, these are essentially first-aid or entry-level ESS. With regard to the capital factor, the results show that half the ESS have a capacity of less than 10 beds, with less than 6 beds occupied by patients, and a ratio of less than 8 beds per doctor and two beds per nurse. This confirms, in capital terms, that half of the EHSs investigated are entry-level.
Level of ESS production or activities
The results of the present study indicate that the median stay in the ESS as a whole was 4 days, with a minimum of 2 and a maximum of 30 days. On the other hand, in each of the different departments, the median length of stay ranged from 3 days in minor surgery, through 5 days in internal medicine, to 7 day in maternity. Furthermore, according to the results of data categorized according to median value, it emerges that more than half of ESS record a length of stay below the median, notably the vast majority of these ESS with an average stay of less than 4 days, with a share of stay in maternity of less than 7 days, and with a share of stay in internal medicine of less than 5 days. However, in more than half of all ESS, the proportion of stays in minor surgery is less than 3 days. If activity is measured in terms of length of stay, this suggests that most private ESS operate like referral health centers.
Statistical measurement of the relationship between production factors and private ESS activity in the N’sele health zone
Apart from the number of doctors, all other production factors are statistically associated with the average length of stay in the ESS as a whole. There are two possible explanations for this: firstly, nursing staff dominate in terms of numbers in these private ESS operating in urban-rural areas; secondly, these ESS are predominantly first-contact, where the role of the nurse is preponderant.
In terms of average length of stay in the departments, the share of stays in minor surgery is statistically associated, on the one hand, with staff numbers in general, and administrative staff in particular, for human resources; and on the other hand, with bed occupancy rates and ratios of number of beds per type of nursing staff. Similarly, the share of stays in internal medicine is statistically associated with bed capacity, bed occupancy rates and ratios of beds per type of nursing staff. The proportion of maternity stays is also statistically associated with the number of administrative staff.
As far as human resources are concerned, given that almost 90% of ESS had a length of stay of less than 7 days in maternity and less than 3 in surgery, on the one hand, and that 60% of ESS had no administrative staff, on the other, this suggests that more administrative staff could be associated with a longer stay in maternity and minor surgery, due to lengthy administrative or bureaucratic formalities.
As far as the capital factor is concerned, the above relationship confirms the French economist Say’s law that supply creates its own demand.3 In other words, according to the results of this study, bed utilization and capacity could have a decisive influence on activity in internal medicine and minor surgery. In fact, Franck Evain and Engin Yilmaz’s (2012) study on the determinants of economic profitability in healthcare establishments highlighted, in addition to the importance of “organizational” factors such as bed occupancy rates, length of stay and staffing levels, the impact of specialization on economic performance.6
Econometric measurement of the relationship between the profile of the private entrepreneur, the organization of production factors and the volume of activity in private health care and service establishments in the N’sele health zone
The results of this study show that the Private Health Contractor Profile has two effects on the volume of ESS activity: a direct effect and an indirect effect. The indirect effect is exerted through the variable relating to the organization of production factors in the ESS. The finding is that the Profile of the private healthcare entrepreneur exerts a positive and significant effect (impact coefficient of 0.487) on the organization of production factors in the Healthcare Establishment. This means that the more favorable the profile of the private healthcare entrepreneur, the more likely it is that the latter will be able to establish an efficient organization of production factors in the ESS.
Similarly, the Profile of the private health entrepreneur exerts a positive, but non-significant effect (impact coefficient of 0.254) on the level of ESS production/activity. This implies that the more favorable the profile of the private health entrepreneur, the more likely it is to increase or improve the level of ESS production/activity.
Based on the various indicators of the latent variables above, it emerges that the elements of the Private Health Entrepreneur Profile that are most decisive in the level of ESS production/activity are, in particular, professional experience (weight = 0.632), age (weight = 0.461) and profession (weight = 0.341).
The results also show that the organization of production factors in the ESS has a positive and significant effect (impact coefficient of 0.439) on the level of production/activity in the ESS. This suggests that the more effective or efficient the organization of production factors, the higher the level of ESS production/activity.
In addition, based on the weights of the various latent variable indicators in this study, we accept that the aspects of the organization of factors of production most decisive in the level of production/activity of the ESS are in particular: reception capacity (weight = 0.940), total number of agents (weight = 0.768) and bed occupancy rate (weight = 0.754).
CONCLUSION
The aim of this study is to investigate the managerial factors of private entrepreneurship that determine the level of activity of private EHSs. To this end, econometric and statistical analysis was used to measure the relationship between the profile of the private health entrepreneur and that of the private health care establishment, on the one hand, and the latter’s level of activity, on the other. The main results are presented below. Firstly, there is an association between staff numbers, in general, and nurses, in particular, on the one hand, and length of stay in private ESS operating in urban-rural areas, on the other. On the other hand, there was no relationship between the number of doctors and activity in this type of ESS.11–15
Then, for the capital factor, there is an association between staff numbers, in general, and administrative staff, in particular, on the one hand, and minor surgery and maternity, on the other. As far as the capital factor is concerned, there is an association between the occupancy rate and the number of beds per type of nursing staff, on the one hand, and the average stay in minor surgery and internal medicine, on the other. Given that the Chi-2 test simply shows the existence of the relationship and not the direction of causality, it was necessary to extend the study with a confirmatory test.16–19
In this respect, we note that the Profile of the private healthcare entrepreneur exerts a positive and significant effect on the organization of production factors in the Healthcare Establishment. Similarly, the Organization of production factors in the ESS has a positive and significant effect on the level of production/activity in the ESS.18,20,21
Acknowledgements
We thank my mother KENA Thérèse and my husband KAMPILA David.
Funding
The research presented in the manuscript received funding from AFROHUN.
Authorship contributions
All the authors mentioned have fulfilled those criteria:
-
Contributions to the conception or design of the work; or the acquisition, analysis, or interpretation of data for the work;
-
Agreement to be accountable for all aspects of the work in ensuring that questions related to the accuracy or integrity of any part of the work are appropriately investigated and resolved.
-
Drafting the work or reviewing it critically for important intellectual content;
-
Final approval of the version to be published;
Disclosure of interests
The authors declare no relevant interests and declare the following activities and relationships:
All support for this manuscript (funding, provision of study materials, medical writing, article processing fees, etc.).
Royalties or licenses
Grants or contracts from any entity
Consulting fees
Payment or honoraria for conferences, presentations, speakers’ bureaus, manuscript writing or educational events, etc.
Correspondence to:
NTUMBA LOMBE FRANCINE
Kinshasa School of Public Health
Kinshasa, Lemba
The Democratic Republic of Congo
francinentumba63@gmail.com