
Existing evidence has demonstrated an interwoven relationship between poverty and healthcare. Health is an important aspect of human capital, and when one is in good health, it can contribute to economic growth. Field.1–5 Poverty is a barrier to healthcare, and conversely, health problems may lead to loss of wages, ultimately leading to poverty. This negative feedback loop is called the health-poverty trap.1
Out-of-pocket payments(OOP) are the sum of all payments made by individuals of the same household to healthcare providers, including but not limited to transport and health fees, after subtracting subsidy by insurance or government.2
OOP is unsustainable and promotes health inequity while furthering the poverty-health trap.3 In Kenya, slightly over four-fifths of the population lack financial protection from health care costs, and about 1.5 million Kenyans are pushed into poverty each year due to OOP spending4
Diabetes is a non-communicable disease both of global health and economic concern. It is predicted that from 2020, the most rapid increase in DM is expected to be in sub-Sahara Africa (SSA) over the next two decades.5,6 Additionally, SSA has an unacceptably high rate of undiagnosed DM at 69% compared to 37% in high-income countries.7 The prevalence of TB and DM and TB and prediabetes in rural areas in Kenya is about 5.1% and 37.5%, and in urban areas, 10.1% and 25.8%, respectively. TB and DM interact synergistically; TB increases the risk of developing dysglycaemia, and while it may resolve at the end of treatment, the risk of developing DM for good persists.8
A diagnosis of DM triples to quadruples the risk of developing TB, and the incidence of people with TB-DM co-morbidity outranks that of TB-HIV co-infection Field.9–11 It additionally contributes to poor treatment outcomes like treatment failure and drug-resistant TB, which costs the Kenya health care system USD 3,230.28 per person treated.12 HIV is an independent risk factor for cardiovascular disease, and a study conducted in Africa has demonstrated the trilateral overlap of TB, HIV and DM. With the increased lifespan of people living with HIV(PLHIV) afforded by modern developments in antiretroviral therapy, there is an increased incidence of metabolic disease, and insulin resistance is critical in this pathway.13 For context in terms of economic implications, the Kenya Health Policy Framework documents that 50-70% of inpatient hospital admissions are due to NCDs, which include DM and cardiovascular disease(CVD).14
Healthcare payments should not increase income inequity; they should not result in catastrophic costs and they should not drive households into or exacerbate existing poverty.15,16Factors promoting the poverty health trap in the Kenyan setting include larger household size, lack of formal education for the head of the household, longer distance to the health facility and being unmarried. The aspect of marriage is hypothesized to be linked to having a dual income in the household.17
The incidence of catastrophic healthcare costs in Kenya is estimated at slightly over 5%. Risk factors that increase the likelihood of this occurrence are: lack of gainful employment of the household head, presence of an elderly person, a person with a chronic ailment, a large household size, lower household social-economic status, and residence in marginalized regions of the country.18
The current healthcare system in Kenya does not meet the principles of UHC. To demonstrate the level of inequity in the Kenyan healthcare system, an example from body of work that conducted Benefit Incidence Analysis (BIA) showed that the richest quintile got over two thirds of services at tertiary facilities with contrast to a meagre 2% for the poorest quintile.19
Kenya had prioritized achieving UHC by 2022, but this goal is not yet achieved. The national payor, National Hospital Insurance Fund (NHIF)-currently undergoing a transition- has a coverage of about 15% which represents four fifths of all people with insurance in Kenya.20 An average of 25% of the Kenyans are covered by a public, private or community-based health Insurance scheme.4The cost of healthcare was found to be higher than the gross domestic product (GDP) of Kenya.21
Scarcity of health economic costing data has made it difficult to define a subsidy package. Within the context of a health system perspective and Bottom-Up (BU) approach, the study aimed to determine the cost of managing a person affected by TB, with or without HIV in addition to diabetes or prediabetes and propose a minimum care package as part of efforts towards universal health coverage in Kenya. During this time of transition to Social Health Insurance Fund (SHIF) in Kenya, this would serve as a model for evidence based costed care to both make resource allocation efficient and accessible in an equitable way. Considering the deaths post TB treatment are mostly of cardiovascular origin with a three-fold risk of death, making dysglycaemia care accessible at an early stage can forestall the economic and mortality burden later down the road.
METHODS
Study design
A cross-sectional, mixed methods nested design was employed in the study. The nested approach was adopted because while most aspects of costing are quantitative, some qualitative aspects like above service level support, training and patient journeys needed to be qualitative to generate robust datasets. The study was conducted between January to June 2023. For health economics studies one needs to decide the costing perspective, our study took the health system perspective. The patient perspective for both TB and DM has already been done locally, the health system perspective for TB only as well. The lacking angle is the health system perspective for TB with or without HIV with dysglycaemia as a comorbidity. In line with the GHCC framework for design of costing interventions, the various components are described in detail (Online Supplementary Document, S1).
Data collection planning and procedures
Pilot study
Prior to commencement of the main study, we piloted the data collection instruments on two levels. First was internal validation by testing the branching and skip logic on the questionnaires using staff who were not involved in the study but had sufficient expertise on the open data toolkit (ODK), Ona and Enketo platforms. External validation with the staff at two healthcare facilities within the approved study area that were not part of the sampled facilities. The pilot was useful in improving the questionnaires on transport and above service level costs as we were able to get a more realistic picture of what items are not available across the board. The GHCC framework is standard but local situations differ from place to place. Training was then conducted. While testing we also put timestamps on the patient journey questionnaires to avoid backdating of patient journeys. Training was conducted for all staff and to ensure a patient journey was not rushed, we only assigned one facility per person per day. This was informed by our pilot.
Recruitment processes
Sensitization of the facilities was done in December 2022 to get buy in of the health facilities and familiarize with their location and travel time. Despite having approval, not conducting sensitization may result in lack of buy in and ultimately not getting cooperation from facilities. We call this community engagement. A call log tracker was maintained on Excel sheet where appointments would be made on phone by study staff. During recruitment, there were challenges like political demonstrations ‘Maandamano’ in local dialect which delayed study processes. Portable field internet and tablets were used in lieu of laptops for ease of movement when doing measurements and data collection.
Study site/area
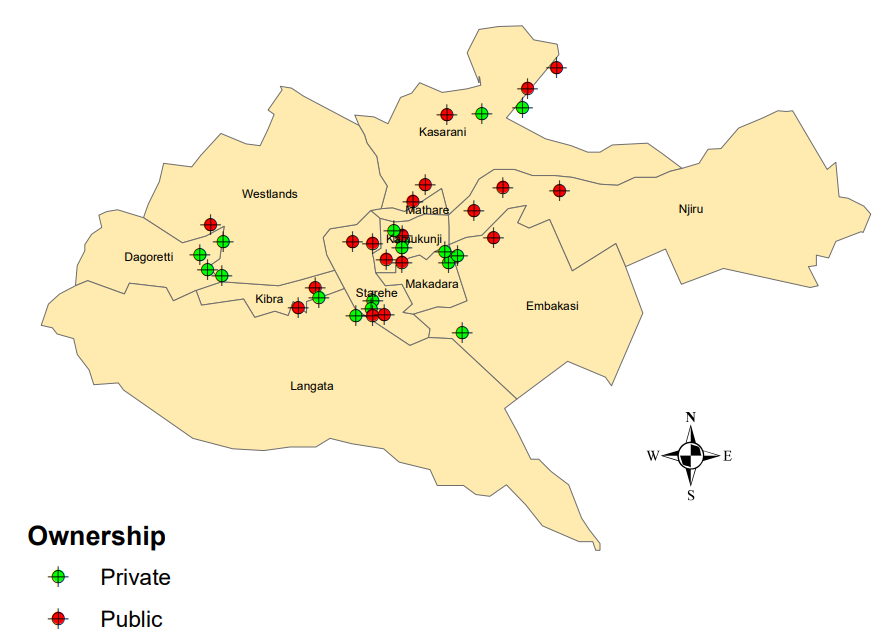
The study was conducted in Nairobi County, Kenya, Africa. Nairobi is Kenya’s capital city. It has a population of 4,397,073 according to the last census conducted in the country in 2019. We selected this county as it is an urban area, and based on local studies has a higher prevalence of diabetes than the rural areas. It similarly has a high TB burden due to overcrowding, urbanization and industrialization. The study area sampled the following sub-counties: Roysambu, Kasarani, Ruaraka, Westlands, Starehe, Makadara, Kamukunji, Langata, Dagoretti, Embakasi. These reasons made it an apt study area for the topic at hand (Figure 1). For the specific healthcare facilities sampled (Table 1).

Study population
Healthcare workers from the 10 sampled sub-counties were included in the study from the cadres of facility-in-charge (FIC), administrators, accountants and laboratory staff. The FIC could be a nurse, clinical officer or medical officer. The nature of the study dictated that we needed to speak to health facility management and as we required information on salaries, valuation and other financial details, it was also necessary to speak to staff in finance and human resource departments. The person interviewed depended on who is in charge at the facility or has ultimate management of the facility.
Sample size
STATA program was used to sample TB-HIV mandated care health facilities randomly yielding 42 facilities. There are 256 TB-HIV care mandated facilities in Nairobi County based on 2017 to 2021, 5 year- reporting data from the Ministry of Health in Kenya at the time of this study. Ten (10) sub-counties out of the 17 sub-counties of Nairobi were sampled.6 health facilities were excluded: 2 due to destruction/ repurposing of the building,1 facility was relocated to Kiambu County which borders Nairobi County but is outside the jurisdiction of the study area and 3 did not consent to the study. Multistage sampling method was used, stage 1 was based on diabetes reporting burden as recorded by Ministry of Health between 2017-2021. In this stage, we had high>75, medium >25-<75 and low <25 based on percentile calculations. During the calculation, this yielded 12,20 and 10 facilities respectively. Stage 2 of the multi-stage sampling was based on ownership/ sector; public versus private (faith and non-faith based). A total of 36 health facilities underwent this health economics study and this was representative of 10 out of 17 sub-counties in Nairobi. It is the facilities and not sub-counties that were sampled. The sub-counties came about as a result of the random sampling.
Data source
Data was collected using 11 questionnaires designed based on the Global Health Cost Consortium (GHCC) GHCC | Global Heath Cost Consortium (ghcosting.org) which provides the World Health Organization (WHO) guidance on costing and cost modelling for tuberculosis (TB) interventions. Prior to using their tools study of the modules is required and was done. The London School of Hygiene and Tropical Medicine (LSHTM) provides the academic training for this. The below 11 forms were used (Online Supplementary Document).
-
Interview planning webform- this outlined the health facility location and general description.
-
Service description webform-this outlined the types of services offered to patients by the health facility.
-
Service statistics webform-this outlined the volume of laboratory and clinical tests and consults offered at the health facility.
-
Building space-this outlined the area of the land and buildings in square meters as well as percentages used for TB, HIV and dysglycaemia care.
-
Equipment inventory-this outlined the equipment owned by the health facility for use in the various areas of patient care.
-
Recurrent expenditure-this outlined the
-
Staff salaries
-
Training
-
Transport
-
Above service level costs
-
Patient journey
Reporting standards
As provided for under the terms of Enhancing the QUAlity and Transparency Of health Research (EQUATOR Network), our health economics research conforms to the reporting standards specified by Consolidated Health Economic Evaluation Reporting Standards (CHEERS 2022) (Online Supplementary Document).22
Instrument validation
The GHCC tool is an already globally validated framework. It is an initiative funded by Bill Melinda Gates Foundation and led by the below academic institutions:
-
University of Washington (UW) Avenir Health
-
University of California San Francisco (UCSF)
-
London School of Hygiene and Tropical Medicine (LSHTM)
-
Mexico’s National Institute of Public Health (INSP)
-
University of Cape Town, South Africa (UCT)
Benchmarking
Benchmarking was done against the GHCC reference case in line with the GHCC tool. Additionally, we benchmarked against locally conducted studies. We benchmarked against the study conducted by Kairu et al (2021) which estimated health system costs of TB in private and public sector and the XTEND study which estimated the cost of upscaling TB diagnostics in South Africa. A point-by-point comparison was not possible since they did not study co-morbidities like in our study but in terms of what they costed and the context of a developing country.
CHEERS 2022 reporting framework of methodology and data analysis
Items 1 to 12 of the framework have already been reported in the methodology described above. The selection and measurement of outcomes for measure(s) of benefit(s) and harm(s) was not applicable for our study as it is not a cost benefit analysis (CBA).
Valuation of outcomes
It was not possible to conduct a valuation using a valuer at each facility due to limitations in resources and approvals required to conduct this. We took the value of the buildings and resources as given to us by the accountants and administrators that we interviewed at the health care facilities.
Measurement and valuation of resources and costs
When computing costs, the private and public facilities were costed separately. Additionally, each disease entity was also valued separately both in Kenya Shillings and United States dollars (USD).
Space
In terms of building space, the study considered the outpatient department (OPD) and triage because our objective focused on: adults, outpatient, stable persons, drug sensitive TB with or without HIV and with either diabetes or prediabetes(dysglycaemia). This costing model does not consider complications of TB, HIV or diabetes that require inpatient treatment. Therefore, we did not cost utilities like food, electricity, water and only considered the lab, pharmacy and OPD and costed utilities as a percentage of these departments. It also does not consider the paediatric population or multi-drug resistant tuberculosis (MDR).
The total building space in square meters was computed for each facility based on length and width provided during data collection. The spaces for the OPD triage and consultation, pharmacy and laboratory were computed as a share of the total building space for each health facility to arrive at how much space is used.
For example, an OPD was XY meters squared over total building space YZ meters squared, this was computed as XY/YZ). This space was valued as a share of overall value of the building. The value of the buildings was provided to us by the health facility management or the finance departments.
When computing each disease entity, we used the percentage provided during data collection by the health facilities; for example, the percentage of the OPD triage and consultation area that is used for TB could be 25% which is a quarter of the room. The percentages provided for each disease entity were then added altogether, and an average generated.
Share market price was derived by multiplying the percentage used by a disease entity by the value of the department.
For the annuitized value or discounting we used 3% and used the formula to generate current value of future cash flow:
Useful life 30 years×market price×3 %
There are schools of thought that have proposed a discount of 5% in LMICs but there is not sufficient evidence for this, so we chose the best current practice of 3%.
The Gross Domestic Product (GDP) deflator was derived from the USD value in the year 2021 to 2022. The value for the year 2023 could not be used as the year was not yet over at the time of computation of costs and the GDP deflator rates are provided on an annual basis at close of year.
2021/2022×the annuitized cost
To derive costs per patient, we used actual case notification data from the national TB reporting system. This was a quality assurance measure to ensure we had the correct numbers. For each of these departments the total area was added to generate total area in square meters. However, for each disease entity only a particular percentage of the room is used. The total of the percentage was added for all facilities and averaged to derive final percentage per costing line item.
Capital costs
For the time taken with each patient, time was given in units of minutes. To derive an annual cost, it was necessary to convert these minutes to hours by dividing by 60, then compute as a share of monthly working hours. However, since during data entry it was given as a working week, a conversion was done to weeks, then to a computation of months and multiplied by 12 to derive annual rate. This was multiplied by the salary to get the annual value.
Minutes to see patient/60×4(conversion factor of weeks to months)×12 (get annual rate)
Formula for deflation and getting annual costs per patient was similar as in the formula for space.
For the consumables and utilities, we used the prices provided by manufacturers and used the minimum purchase unit. To further compute costs, the percentage of time used per machine was incorporated.
Currency, price date, and conversion
Currency used was Kenya Shillings (KES) and United States Dollars (USD), the conversion rates used were based on the average for the year 2022 from the World Bank. https://data.worldbank.org/country/KE
The Gross Domestic Product (GDP) deflator used was also for between 2021 to 2022. https://data.worldbank.org/indicator/NY.GDP.DEFL.KD.ZG?locations=KE
Rationale and description of model
This is not applicable as our study did not use mathematical or theoretical modelling but was based on actual primary data collected.
Analytics and assumptions
-
GDP Deflator= 128.009 for 2021 and 135.7009 for 2022 2. Exchange rate (1 USD to KES) = 146.54 (Average for 2022), Source World Bank (World Development Indicators)
-
Discount rate- 3% discount rate was used.
-
Building Useful life- Assumed 30 years.
-
Equipment- Assumed a life of 5 years.
-
Salaries of Staff- Assumed average salary scale for each category of staff (Doctor, Nurses, lab technicians and pharmacist), irrespective of ranks
Characterizing heterogeneity-how the results of the study vary for sub-groups
There is heterogeneity in terms of private and public sector and the costing was done per sub-group to ensure this is taken care of.
Characterizing distributional effects (how impacts are distributed across different individuals or adjustments made to reflect priority populations)
For the case of costing, outliers are expected due to diversity of the health facilities in terms of location (various sub counties), size (larger referral facilities versus lower-level facilities). Our study opted to use mean and not median as it is representative of the entire data set without focusing on the central value only unlike the latter. Additionally, when we benchmarked for methodology, the Kairu et al study (2021) that was conducted locally in Kenya used the mean. We arrived at a slightly similar value for the health system perspective cost of TB only varying due to the USD forex rate in 2021 versus 2023.
Characterizing uncertainty in the analysis
The value of the resources was provided was not based on a valuer conducting a valuation at the time of conduct of the study but rather based on the last valuation available on record at the health facility and this may be a source of uncertainty for the analysis.
Approach to engagement with stakeholders
Sensitization was conducted at each health care facility speaking to them on the intention to conduct a health economics study to evaluate how we can combat the syndemic of TB, HIV and dysglycaemia and evaluate ways to generate a minimum package to promote subsidy of care for the disease entities.
We engaged the national diabetes association; the Kenya Diabetes Study Group (KDSG), The National TB Leprosy and Lung Disease Program (NTLLDP), the Kenya Association of Physicians(KAP) and the National AIDS and STIs Control Programme (NASCOP). There was an overwhelming supportive response because there have been efforts to try and get a subsidy on dysglycaemia care but they did not go through because there was no locally conducted research to generate data to support the subsidy process. Once published, we intend to fully engage the national payor, Social Health Insurance Fund (SHIF), previously the National Hospital Insurance Fund (NHIF) as well as the KDSG, NTLLD-P and NASCOP to jointly discuss a possible policy change for a minimum care package.
Cost measures
Study outcome variable was the health system cost of managing TB with or without HIV in the presence of dysglycaemia (prediabetes or diabetes) and a minimum package care proposal. The health system perspective using BU approach was assumed in the estimation of total costs.
Data analysis
The patient journey was core in determining the flow from one station to another within a health system setting. Exposure variables were also based on literature. Two scenarios are available for the patient care pathway; actual care pathway in line with what the health care facilities are currently practicing and a minimum care pathway based on international and local Kenyan guidelines for best practice (Online Supplementary Document, S3 and S4).
RESULTS
Average health system costs of TB, HIV and DM
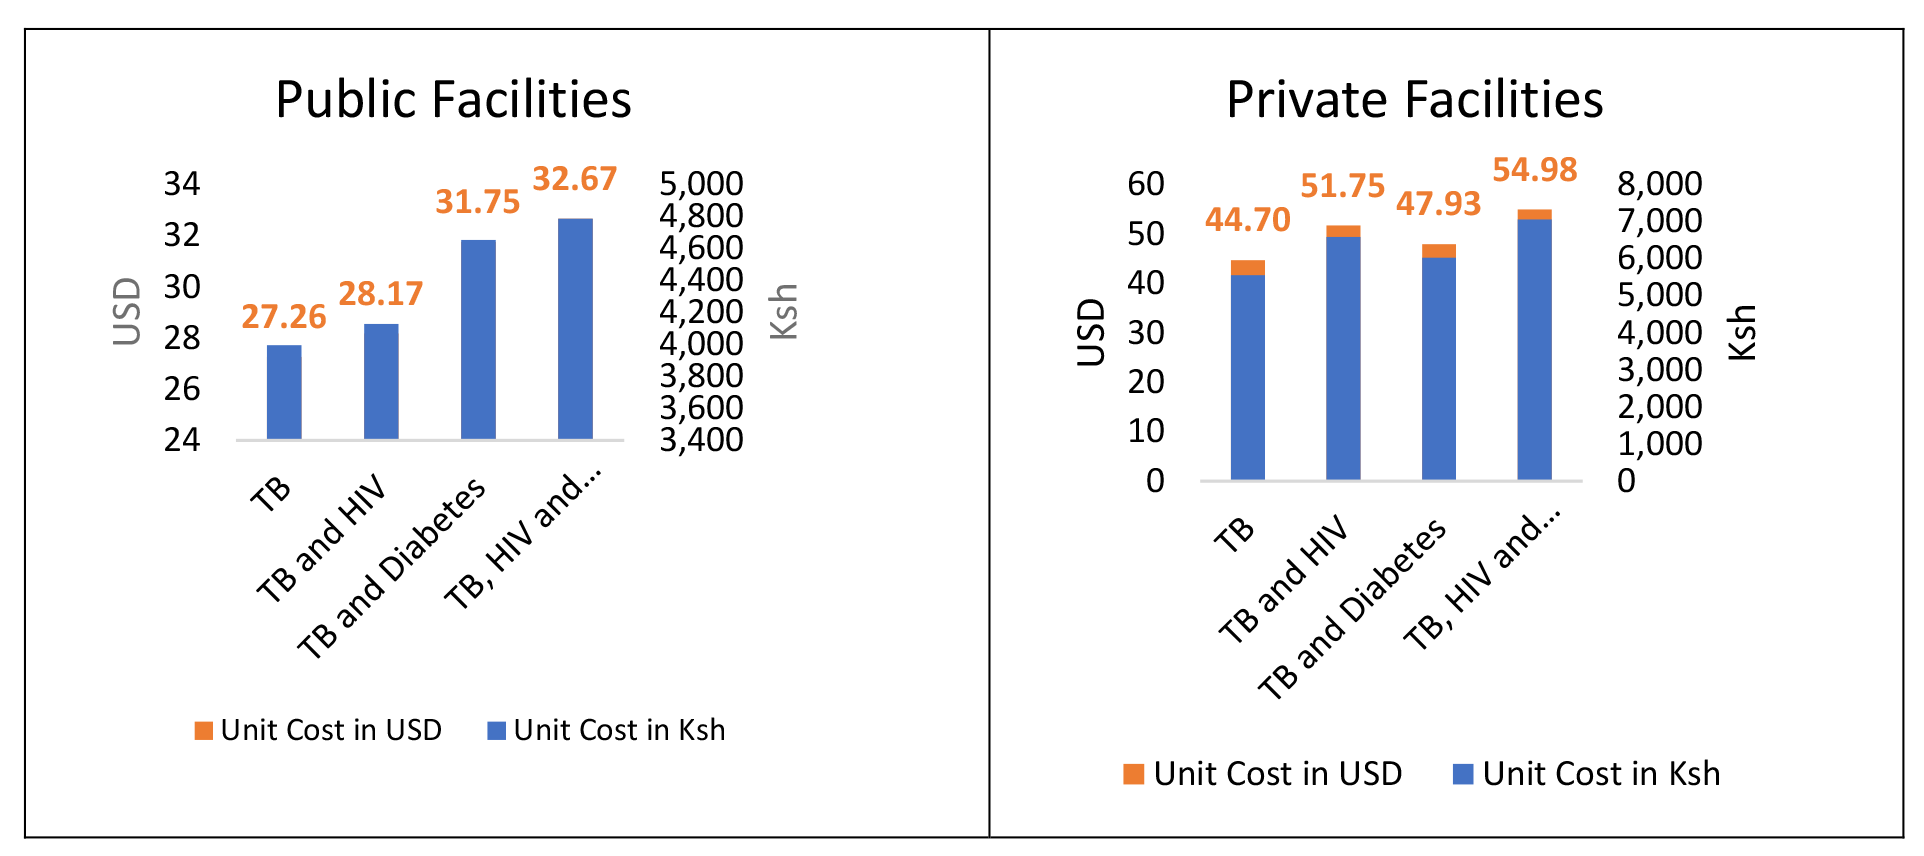
The average costs associated with the health system for the screening, diagnosis and annual risk counselling of patients with tuberculosis (TB) were found to be United States Dollars ($), USD 27.26 in public health facilities and USD 44.70 in private health facilities. The health system costs for patients with TB and HIV averaged USD 28.17 for public health facilities and USD 51.75 for private health facilities. For the patients with TB and Diabetes, the health system related costs averaged USD 31.75 for public health facilities and USD 47.93 for private health facilities. For the patients with all the three diseases (TB, HIV and Diabetes), the health system related costs averaged USD 32.67 for public health facilities and USD 54.98 for private health facilities (Table 2, Figure 2 and Figure 3).
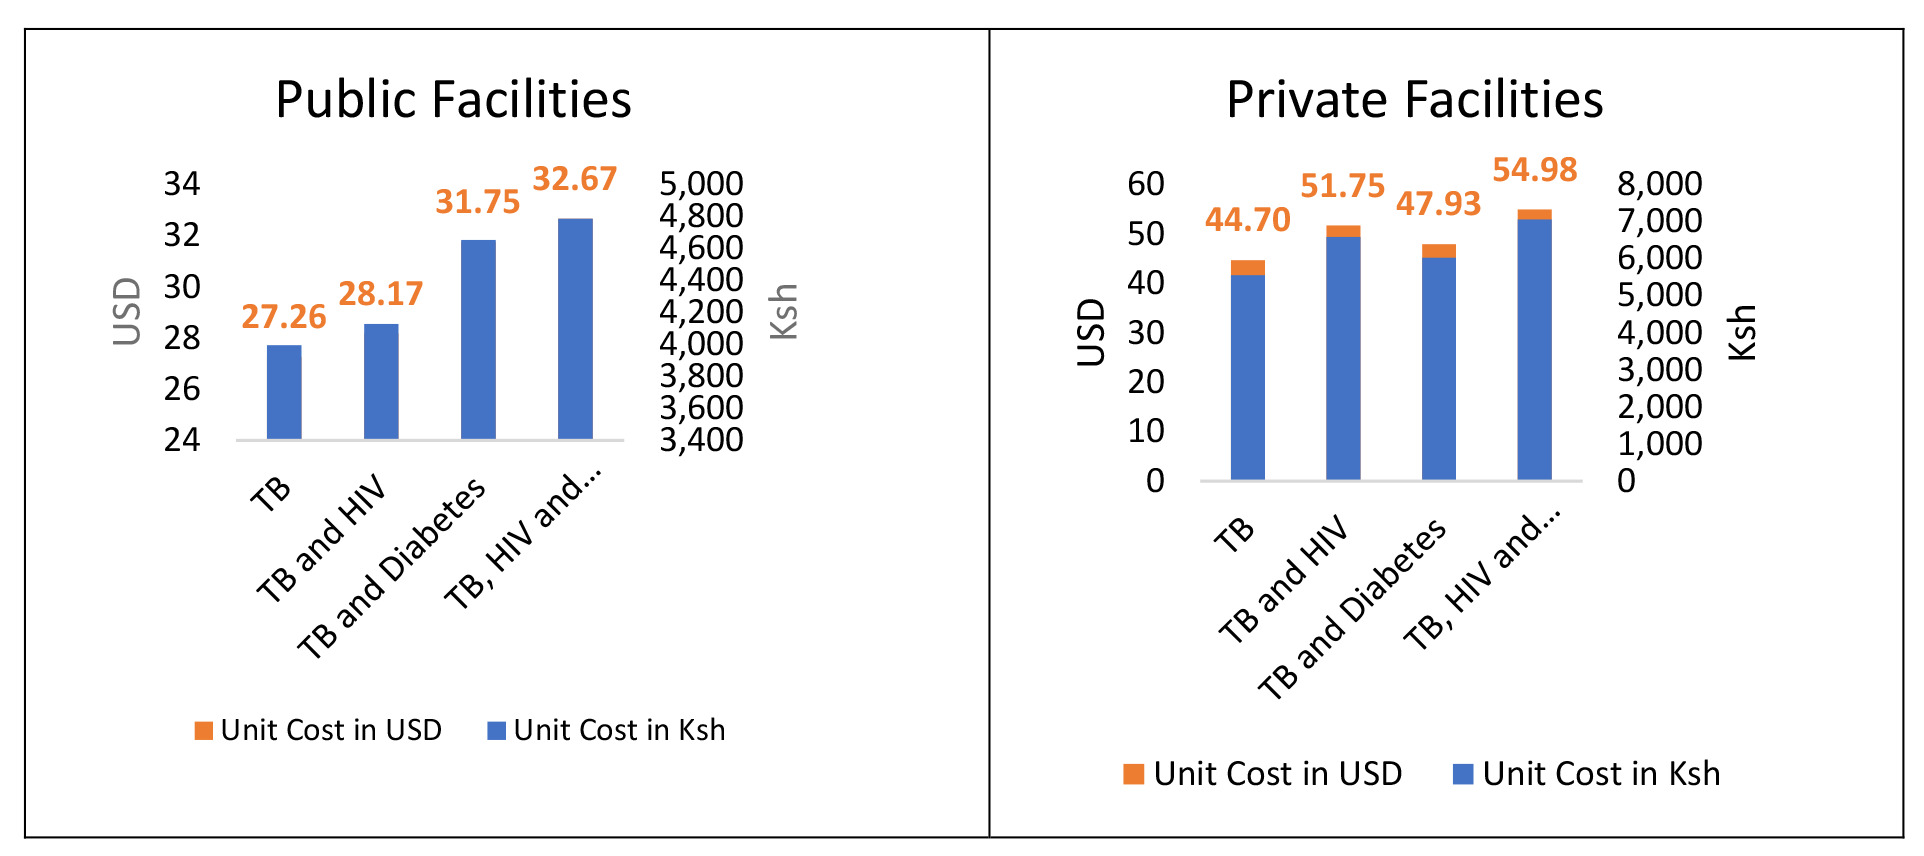

The additional expenditures for HIV patients raised the unit cost for TB patients by 3.2% in public health facilities and 13.6 % in private health facilities. For people living with diabetes, the additive charges raised the unit cost of TB patients by 6.7% for private health facilities and 14.2% for public health facilities. Overall, the additional expenses for HIV and Diabetes patients raised the unit cost for TB patients by 16.5% and 18.7%, respectively, for public and private health institutions.
Minimum care package from health system perspective
Computing of the minimum care package is based on the patient care pathway of both our costing exercise (real world evidence costing) and additional best practices not currently done, but based on international standards (guideline -based costing). (Table 2). The cost for a first line treatment (FLT) is derived from previously done health system costs of TB only by Kairu et al 2021 (Online Supplementary Document).
DISCUSSION
This study demonstrates the cost of care for the two disease entities in Kenya from a health system perspective. Our health system perspective costing for TB only tallies or benchmarks well with previously conducted work done using the BU approach. Our results show the cost of passive case finding (PCF)to be USD 27.26 and USD 44.70 in public and private health facilities respectively and the average of the two is USD 35.98 while previous work showed this cost to be USD 38. This slight difference by a few USD is accounted for by the rise in the value of the USD against the Kenyan Shillings (KES) which has gained approximately 40% in value since then. It has been proposed from previous studies that the BU approach more accurately captures the costs as it considers inputs at a granular level with contrast to a top down (TD) approach.23
DM care is currently not subsidized in Kenya. Despite TB care being ‘free’, patients bear a substantial proportion of costs. The costs demonstrated in our study relating to DM are borne by patients. For context, from a patient perspective, costs from a patient perspective and found the cumulative costs of drug-sensitive TB and drug-resistant TB to be USD 261 versus USD 1452, respectively.24 In terms of DM costing, the patient-perspective costs have also been quantified; the mean annual direct cost was US$ 528.5 (KES 53,907).25It has also been demonstrated that the costs during treatment impose a heavy economic burden on patients and their households.24
From our results, the cost of having diabetes as a co-morbidity raises the cost of healthcare regardless of the sector. Overall, the additional expenses for HIV and DM patients raised the unit cost for care of TB by 16.5% and 18.7%, respectively in both public and private health institutions. This is a large increment in cost. Since diabetes care is not subsidized, this is borne by the patient either as OOP expenditure or by the patient’s private health insurance cover. Itemized costing shows some equipment lacking in the public sector and may account for the semblance of the costs being lower.
LMICs like Kenya have been estimated to have OOP spending at almost two thirds compared to a fifth of the spending in high income countries meaning the poorest are hit hardest and not shielded from catastrophic costs.26 OOP is unsustainable and promotes health inequity while furthering the poverty-health trap. In Kenya, almost 1.5 million people are pushed into poverty due to OOP spending.4 In terms of access, distance, availability of the services, financial accessibility(cost and willingness to pay) and behavioural factors like acceptability influence how the population can access health care and are important considerations for a health system.3
In our results, having DM as a co-morbidity has an incremental cost on the health care system. However, this increment should be viewed in context. The increase in care is not as significant as the cost of waiting to treat the complications of DM with TB with or without HIV. Local health system costing of TB only has demonstrated that the cost of treating multi-drug resistant TB(MDR-TB) is USD 3,230.28 (KES 323,000).12 Given that DM and the spectrum of dysglycaemia like transient hyperglycaemia and prediabetes lead to poor treatment outcomes like treatment failure, relapse and drug resistant TB, our results indicate that this modest increase in cost of care for the health system is worth pursuing to avoid larger costs downstream once poor treatment outcomes have already occurred. The proposal places the cost at KES 35398.15 or USD 241.53 which is a far cry from the cost of paying for MDR.
Our proposal for a minimum care package is an early attempt at evidence-based change in policy using a sub-group of patients which can be ultimately scaled up to include all people living with diabetes if successfully implemented. There is indeed general consensus that dealing with poverty-health trap in a narrow perspective may not be sustainable and only improves health outcomes in the short term. Supportive socio-economic policies and subsidies are needed to break the vicious cycle.27,28Our proposal is also aligned with the Kenya Health Policy Framework objectives whose Policy objective 2 is to reverse and halt the rising burden of NCDs and mental disorders.14
Kenya is a signatory to Astana Declaration (2018) which highlighted the importance of community health services in advancing Universal Health Coverage. The proposal for a minimum care package is just in time as it incorporates community health promoters (CHPs) previously known as community health volunteers (CHVs) for continuity of care like self-monitoring of blood glucose (SMBG) using a glucometer once they go home after getting their TB medication. It seamlessly integrates with an existing system. This is in line with the Kenya Community Health Strategy 2020- 2025 which is supported by the local government where CHPs would have basic healthcare equipment in a backpack and perform basic testing, education and referral at a community level.29
The minimum care package proposed follows the international American Diabetes Association (ADA) and local Kenya Diabetes Guidelines.30,31 It is inclusive of both prediabetes and DM as the former would be detected at baseline screening and be tracked at an end of treatment screening.
Given the additive costs of DM even from a health system perspective, and the fact that it has already been demonstrated that DM and TB result in catastrophic costs to patients, health seeking behaviour would change based on the cost. Indeed, a body of work in Kenya has examined the effect of poverty on the health seeking behaviour and the key personal characteristic that influenced choice of provider was the ability to pay or afford the healthcare service. They conclude that poverty has a negative effect on demand for healthcare services.17 In Kenya across the counties, between 4.1 to 40% of people forgo care due to financial barriers especially the need to pay for costs out of pocket.20,32
Finally, our line-by-line analysis shows that unit costs for consumables both laboratory and non-laboratory contribute to 20% of the cost of care across disease entities and when laboratory equipment costing and maintenance is added, this increases to half the cost. However, when one examines the allocation of funds and spending trends in the various counties, most of the budget, (70%) goes to wage bill leaving very little for programming costs, consumable items and priority interventions.4
Strengths and Limitations
Random and wide sampling (ten of seventeen sub-counties) to reduce likelihood of bias from cherry-picking healthcare facilities. The study location is urban and has more access to information therefore the findings of the study can be transferred to design programs for integration of dysglycaemia testing within TB and HIV in the counties outside Nairobi. The electronic case report form (eCRF) questionnaires were administered by health care professionals with rigorous training and testing and retesting for validity ensured rigor in the method. The patient journey forms had time stamps to ensure the data’s rigour and prevent erroneous data entry.
The study is cross-sectional, which by inherent design means we cannot draw inferences. For example, we notice the cost of TB and HIV is higher than TB and DM in the private sector, but we cannot infer why this is the case. Valuation of capital assets like buildings is a source of uncertainty as it is based on health facility documentation as of the study. It would have been ideal to have a valuer do this, but it is logistically difficult to value each facility.
CONCLUSIONS
Our study addresses two important sustainable development goals (SDGs); SDG 3 on infectious disease and non-communicable disease as well as SDG 10 on provision of social protection and investing in health both of which can reduce poverty by preventing catastrophic costs and impoverishment. The cost of dysglycaemia (prediabetes or diabetes) in TB with or without HIV is incremental to the health care system in Kenya, and ultimately to patients since this is currently not a subsidized cost. Our study’s minimum care package proposal aligns with efforts towards UHC in Kenya and closing the health inequity gap. The study lays a foundation for future implementation science studies focusing on feasibility and scalability of the minimum care package for dysglycaemia and TB and HIV and in NCDs; an important effort towards combating an important and neglected risk factor to TB; diabetes and mitigation of cardiovascular risk in this patient group. Importantly, we provide a framework for evidence-based costing of care for the current transition to the national payor, SHIF. Our work contributes to the GHCC database as the framework can be used by other countries who wish to cost this important determinant (diabetes and prediabetes) for TB alongside the provided framework of TB and HIV. County and national government allocation of funds in health care spending needs an overhaul to promote financial efficiency by priority.
Acknowledgements
We are grateful to all the participating health care facilities, policy makers and study participants for giving their time and insights. Acknowledgement is due to the University of Nairobi, Kenya AIDS Vaccine Institute-Institute of Clinical Research (KAVI-ICR), University of Washington-GAP Kenya (Rael Kemunto, Mary Kalunde, Maureen Odongo, Ken Makhanu, Ken Mutiso) for their support in logistics and hosting of the study. Special acknowledgement to Toney Odhiambo of the UW-GAP Kenya for his extraordinary efforts in facilitating the study ongoings. We also acknowledge the Centre for respiratory Disease Research-Kenya Medical Research Institute (CRDR-KEMRI) and the Centre for Public Health Research- Kenya Medical Research Institute (CPHR-KEMRI) for immense support and hosting the work as well as providing soft resources and logistics for the study. We also thank the National Tuberculosis Leprosy and Lung Disease Program (NTLLD-P), the Kenya Diabetes Study Group (KDSG) for their support and insights. We thank Ian Ochieng of ScienceScope Limited for providing manufacturer brochures for current pricing of equipment.
Ethics statement
Verbal informed consent was obtained from the participants for all the interviews and study processes in line with approval issued. For this study, no written consent was necessary as our approval was for verbal consent. The verbal consent was obtained for both interviewing and publication and dissemination of results. All participants were informed and agreed to this. We have 4 health facilities where consent was not granted and they were therefore not included in the study. This study was conducted in line with Good Clinical Practice (GCP), Declaration of Helsinki, and Belmont Declaration. The respective ethical bodies approve it; Scientific Ethics Review Unit (SERU) of the Kenya Medical Research Institute (KEMRI) KEMRI 048/SSC 3988(16APR2022), Kenyatta National Teaching and Referral Hospital-University of Nairobi-Ethics Review Committee (KNH-UON-ERC) under study code KNH-UON-ERC P431/03/2022(31MAY2022) and the Human Subjects Protection (HSP) committee of the University of Washington Institutional Review Board (UW-IRB) under study code UW IRB STUDY00009209(07JUL2022). All data was anonymized, and no personal identifiers were attached to the questionnaires. Study data collection equipment had credential-controlled access. All staff were trained and certified in GCP and ethics processes.
Data availability
Data sets may be availed from the corresponding author upon reasonable request.
Funding
Research funding was received from the Firland Foundation under award number 20220002, Fogarty International Centre of the National Institutes of Health (FICNIH) award number D43TW011817-01 and L’Oreal United Nations Educational, Scientific and Cultural Organization (UNESCO) grant award 4500494784.The content herein is the authors’ sole responsibility and does not represent the official views of the funding organizations. The funders had no role in study design, data collection and analysis, decision to publish, or preparation of the manuscript.
Authorship contributions
Conception or design of the work: CK
Data collection: CK, SM, SMB, AK
Data analysis and interpretation: CK, RK, VK, RK, AR, OA, MM, JO, EN
Drafting the article: CK
Critical revision of the article: CK, MM, OA, JO, BV, EN, AR, DK, RK, VK, RK
Final approval of the version to be submitted - All authors approved final version of the submitted article.
Disclosure of interest
The authors completed the International Committee of Medical Journal Editors (ICMJE)Disclosure of Interest Form (available upon request from the corresponding author) and disclose no relevant interests.
Reflexivity Statement
Our study is committed to closing the global health research equity gap and included wide collaboration. There is a gender balance and the researchers reflect various academic and professional backgrounds including clinical and interventional medicine, public and global health, information technology, health economics, statistics, molecular medicine, psychology and translational research. There is also varying levels of seniority from professors to early career scientists and students undergoing mentorship.
Correspondence to:
Cheryl Zawadi Kerama
Institution: University of Washington-Global Assistance Program/Centre for Respiratory Disease Research-KEMRI
Address: Nairobi
Country: Kenya
email: cherylkerama2019@outlook.com; ckerama@uw.edu