

Despite a global decrease in the prevalence of stunting,1 there still exist over one-third of the world’s undernourished children in sub-Saharan Africa2 with undernutrition accounting for 45% of under-five deaths. Nigeria has the highest burden of malnutrition in Africa and the second highest in the world, with one out of every three children being stunted and one of every ten children wasted.1 Among children under the age of 5, those aged 6-23 months are at a greater risk of suffering from malnutrition.3 To reduce malnutrition, morbidity, and mortality rates, the World Health Organization has set the “Minimum Acceptable Diet” guideline for children under the age of 5.4
Minimum acceptable diet (MAD) is one of the eight indicators of infant and young child feeding (IYCF) practices according to the World Health Organization4 and it is essential to ensure appropriate growth and development for infants and children aged 6-23 months.5 The MAD ensures diversity of diet which contains the necessary nutrients a child would need for proper growth and development, thereby preventing undernutrition and associated health issues which could result in long-term consequences for nutrition and health, because this period of complementary feeding — from 6–23 months — is the time of peak incidence of growth faltering, micronutrient deficiencies and infectious illnesses.6–9 Studies have shown that children who meet the MAD guideline intake while taking in breastmilk coupled with the parent receiving guidance regarding complementary feeding during postnatal consultations were directly associated with improvement in the child’s health, growth, and development10,11
Studies conducted in Ethiopia, Nepal, South Asia, and Uganda have reported certain factors and predictors associated with MAD which include the child’s age, media exposure, region, mother’s occupation, mother’s education, place of birth, residence, time of postnatal care visit, early initiation of breastfeeding, currently being breastfed, household wealth index and household size.12–15 However, there is a dearth of a nationwide study that assessed the predictors of MAD among children in Nigeria. Hence, this study aimed to assess the predictors of MAD among children aged 6-23 months in Nigeria.
METHODS
This analysis used data from the nationally representative Nigeria Multiple Indicator Cluster Survey (MICS), which was carried out in Nigeria in 2021. The Nigerian National Bureau of Statistics (NBS) conducted the survey with UNICEF’s assistance.
UNICEF’s MICS gathers data on various variables related to the status of women and children in different countries, allowing for global comparisons. In contrast, the Nigerian government uses the Nigerian Immunization Coverage Survey (NICS) to obtain accurate data on vaccination coverage indicators, essential for assessing the program’s effectiveness. For the first time in 2016–2017, Nigeria’s fifth MICS survey was combined with the NICS survey, paving the way for their simultaneous use in the 2021 round.
The fieldwork for the 2021 MICS-NICS survey was conducted from September to December of that year. This survey was representative at the national, zonal, and state levels, as well as for urban and rural areas. It utilized a two-stage stratified sampling design. The survey report provides detailed information on the sampling technique.16
The MICS targeted a sample size of 1,850 clusters. To enhance the combined sample of children and improve the accuracy of vaccination coverage indicators, an additional 337 clusters were selected for the NICS, resulting in a total of 2,187 clusters for the MICS-NICS. However, approximately 128 clusters could not be visited due to inaccessibility. In Borno State, sampling was conducted in only 7 out of 27 local government areas that were accessible, covering 29% of the state’s total population.
For this study, we took data from the publicly accessible children’s dataset of the survey for all children between the ages of 6 and 23 months (183 days and 729 days).
To derive data on homes and mothers, the children’s dataset with the household and women dataset were combined. The household and women datasets were initially merged using a “one-to-one” merge. After this, the resulting dataset was further merged with the children’s dataset.
Only 2622 of the 31106 children in the original dataset were suitable for analysis. Missing values and children from age categories that were not eligible were also removed. We analyzed all the eligible data from the MICS dataset for children aged 6 to 23 months, which enabled us to provide nationally representative estimates of the prevalence of MAD and its predictors in Nigeria.
Outcome Variable
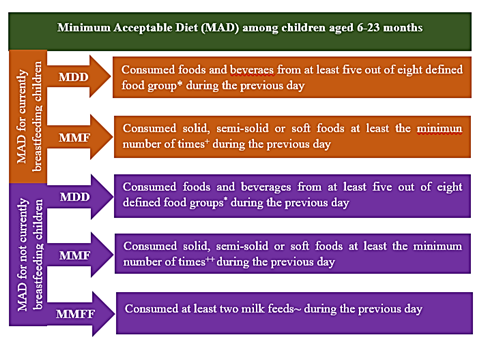
The outcome variable for this study was MAD. In this case, the definition of MAD for currently breastfeeding children was “receiving at least the minimum diet diversity (MDD) and minimum meal frequency (MMF) for their age during the previous day.” Similarly, the definition of MAD for children not currently breastfeeding was “receiving at least the MDD and MMF for their age during the previous day as well as at least two milk feeds”.17 The definition of MAD is shown diagrammatically in Figure 1.

Explanatory Variables
The selection of explanatory factors for the analysis was informed by the findings of13 literature review as well as the data accessibility of the Nigeria MICS dataset. Based on the conceptual framework of the study, as shown in Figure 2, contextual factors pertaining to households and geographic areas that can affect child feeding practices were considered in addition to the mother’s and child’s characteristics.
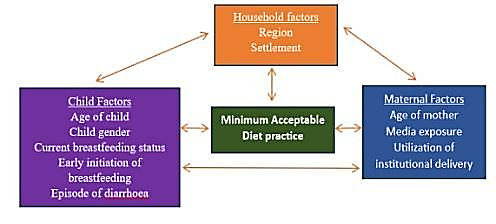
Child variables included age, sex, the status of early initiation of breastfeeding, current breastfeeding status, and episodes of diarrhea in the past two weeks. Maternal variables included age, media exposure, and use of institutional delivery. The household variables were: Region which was categorized into Northcentral, Northwest, Northeast, Southeast, South-south, and Southwest region, Settlement which was categorized into rural and urban.
The explanatory variables are listed in Table 1.
Statistical Analysis
Data were analyzed using SPSS version 26. Univariate analysis was carried out to analyze selected socio-demographic characteristics, nutrition status, and diarrhoea status of children aged 6–23 months and mothers. Chi-square tests were used to check the factors associated with the status of Minimum Acceptable Diet (MAD). Bivariate logistic regression was also conducted to examine the crude association between the status of Minimum Acceptable Diet and sociodemographic, and socio-economic information of children.
Results
Sociodemographic characteristics
Nearly three-quarters (72.1%) of the children were aged 12-23 months. Among the sample population, 20.3%, 19.2%, 26.0%, 9.5%, 12.5%, and 12.5%) were from Northcentral, Northeast, Northwest, Southeast, South-south, and Southwest respectively. More than two-thirds (70.6%) were children living in rural areas. Girls made up 49.7% of the sample population. The mean age of the mothers was 28.91± 7.51 years. More than half (57.4%) of the mothers did not have media exposure, 52.8% had institutional delivery, 76.0% of the mothers initiated early breastfeeding, while 69.0% of the children were currently breastfed by their mothers (Table 2).
Minimum acceptable diet for children aged 6-23 months
More than one-third (41%) of the mothers did not feed their children with a Minimum Acceptable Diet (figure 3)

Relationship between the sociodemographic data and the status of minimum acceptable diet for children aged 6-23 months
Using a Chi-square level of significant p-value of <0.05, there was a significant association between the region (p = 0.0001), age of child (p = 0.0001), media exposure of mothers (p = 0.001), and institutional delivery (p = 0.042) on the status of minimum acceptable diet for children age 6-23 months (Table 3).
Logistics regression
The logistics regression shows that children from the Northeast, Northwest, South-south, and Southwest were 16%, 16%, 12%, and 41% less likely to receive Minimum Acceptable Diet respectively, and children from the south-eastern region were 60% more likely to receive Minimum Acceptable Diet than children from the Northcentral region (OR=0.803, p-value=0.196; OR=0.836, p-value=0.164; OR=0.887, p-value= 0.422; OR=0.585, p-value=<0.001; OR=1.604, p-value=0.007). Children aged 6-12 months were 88% more likely to receive a Minimum Acceptable Diet than children aged 12-23 months (OR= 1.884, p-value= <0.001). Children from the urban settlement were 12% more likely to receive a Minimum Acceptable Diet than children in the rural settlement (OR= 1.124, p-value=0.264). Children whose mothers had media exposure were 24% more likely to receive a Minimum Acceptable Diet than children whose mothers were not exposed to media (OR=1.235, p-value= 0.027) and Children who had early initiation of breastmilk were 11% more likely to receive a Minimum Acceptable Diet than children who did not.
DISCUSSION
To our knowledge, this study is the first population-based study to examine the status and the predictors of MAD among children aged 6-23 months in Nigeria. This study revealed that 59% of the children met the Minimum Acceptable Diet. This finding is higher than the report of MAD met by children in Nepal (30.1%)13 Ethiopia (10.44%),18 Jig-Jiga, Somali region, eastern Ethiopia (47.2%),19 Congo (33%)20 (Kambale et al., 2021), China (27%),21 Malawi (8.4%),22 and Ghana (13.8%).23 The possible reasons for these differences might be due to food security, and economic conditions, among others in the study locations. In Ethiopia, the study was carried out in selected places at Keble, in which some of the places are known to experience chronic food insecurity due to variable rainfall patterns, and the population, especially those residing in lowland Keble’s are users of government safety net program,24 while in Malawi, the economy is based primarily on agriculture, that accounts for about 30% of the gross domestic product.22
A high percentage of the Minimum Acceptable Diet in a country is necessary for optimal growth and development in children aged 6–23 months and majority of this population who met the MAD were in the southeast region of Nigeria. This could be attributed to the high maternal education level reported in the southeast region in this study which may have been responsible for the mothers’ awareness of the Minimum Acceptable Diet.21,25 Evidence has shown that mothers’ education is directly linked to their control over household resources, ability to make decisions, and changes in traditional beliefs.26
The region, child’s age, and media exposure of the mother were predictors of the Minimum Acceptable Diet in this study. Children from the south-eastern region are more likely to have a Minimum Acceptable Diet than children from the Northcentral region. This could be attributed to greater exposure to formal education that the mothers may have received which empowers women with the knowledge of complementary feeding,27 and greater mean household wealth which makes it possible to afford a range of complementary diets.28 Evidence from similar studies has reported that nutrition education improves knowledge and practice of complementary feeding.29,30 Conversely, a low prevalence rate of consuming the Minimum Acceptable Diet was observed in the Southwest region of Nigeria. This could be a result of the declining state of food security in the southwest region31 due to a violent conflict between the Hausas and the Yorubas tribes as a result of some misunderstanding.32
In this study, children aged 6-12 months were more likely to receive the Minimum Acceptable Diet than those of 12-23 months. This is in contrast to similar studies done in Nepal,13 Ghana23 Gambia,33 and Ethiopia.34 Also, mothers who had media exposure showed higher odds of providing the Minimum Acceptable Diet supply for their children compared to their counterparts without media exposure. This is consistent with findings from33,35 in which mothers with adequate media exposure were about 2.8 times more likely to practice adequate dietary diversity compared to mothers without adequate media exposure. Information on maternal and child nutrition including IYCF can be seen or heard through mass media like television, radio, and newspapers, which could increase the likelihood of adherence to the children’s consumption of the Minimum Acceptance Diet19 An example is the radio campaign on WE FM 106.3 live in Abuja where the importance of nutrition in women and children are discussed.35 Education on complementary feeding should therefore target mothers of young children to give such children diversified diets that also meet their adequate meal frequency.
Likewise, those who delivered their babies in a health centre had adequate Minimum Acceptable Diet status compared to their counterparts who didn’t deliver in a healthcare facility. This is similar to the study done in Nepal where children who had institutional delivery had 1.15 times more odds of achieving MAD than their counterparts.13 This could be attributed to the health education provided in the health centres which may have influenced mothers to adhere to the requirements of MAD. Some studies support that an increase in maternal education, maternal empowerment, and knowledge regarding infant feeding indicators can improve Minimum Acceptable Diet adherence.19,27,29,36
There was however no statistical significance between the gender, current breastfeeding status, maternal age, and the Minimum Acceptable Diet status of the children, which is consistent with the results from Teshale et al in East Africa.37 Children from the urban settlement are more likely to receive the Minimum Acceptable Diet than children from the rural settlement. This could be a result of higher media exposure37 and high maternal education level38 which leads to increased knowledge of the Minimum Acceptable Diet, consistent with studies from Uganda15 and.39 Also, children who had early initiation of breastmilk were more likely to receive a Minimum Acceptable Diet than children who did not. This is similar to studies done by13,23 An explanation could be that mothers of children who had early initiation of breastmilk are more likely to have had institutional delivery or received information about new-born care, breastfeeding practices, and Minimum Acceptable Diet40
Study strengths and limitations
Our study used data from a nationally representative survey to provide information on predictors of MAD among children aged 6-23 months in Nigeria. This use of a nationally representative survey makes the findings of our study generalizable. Also, this study used the most recent definition of MAD by WHO and UNICEF which provides us with current information on specific groups to address child malnutrition in Nigeria.
The cross-sectional design of this study provides a limitation as it cannot be used to establish a causal relationship between MAD and other variables. Also, data collected from the women on the feeding practices of the children may have been subject to recall bias and social desirability phenomenon, which may have resulted in underreporting or over-reporting of data.
CONCLUSIONS
Our study found that region, age of the child, exposure to media, and the delivery in a health facility significantly predicted the MAD among children. Therefore, exposure to media and the delivery of babies in a healthcare facility should be encouraged. The findings from this study can inform nutrition-specific programs and policies to improve the practices of IYCF and nutritional status among children aged 6 to 23 months in Nigeria.
Data availability
The data used for this study is the 2021 Nigeria Multiple Indicator Cluster Survey (MICS). This data is publicly available at https://www.unicef.org/nigeria/media/6316/file/2021 MICS full report .pdf
Funding
This research received no external funding.
Authorship contributions
IO, RO, and MA conceptualized the study. IO, RO, and MA were involved in the data collection, analysis, and interpretation. GA and TS wrote the first draft of the manuscript. IO, RO, MA, GA, TS, EO, and TO worked on the second and third drafts of the manuscript. All authors agreed to the final version of the manuscript
Disclosure of interest
The authors completed the ICMJE Disclosure of Interest Form (available upon request from the corresponding author) and disclosed no relevant interests.
Correspondence to:
Ruth Oladele, Slum and Rural Health Initiative, 11 Abiodun Akerele Street, Bodija, Ibadan, Nigeria, ruth.oladele@srhin.org
Isaac Olufadewa, Slum and Rural Health Initiative, 11 Abiodun Akerele Street, Bodija, Ibadan, Nigeria, Isaac.olufadewa@srhin.org